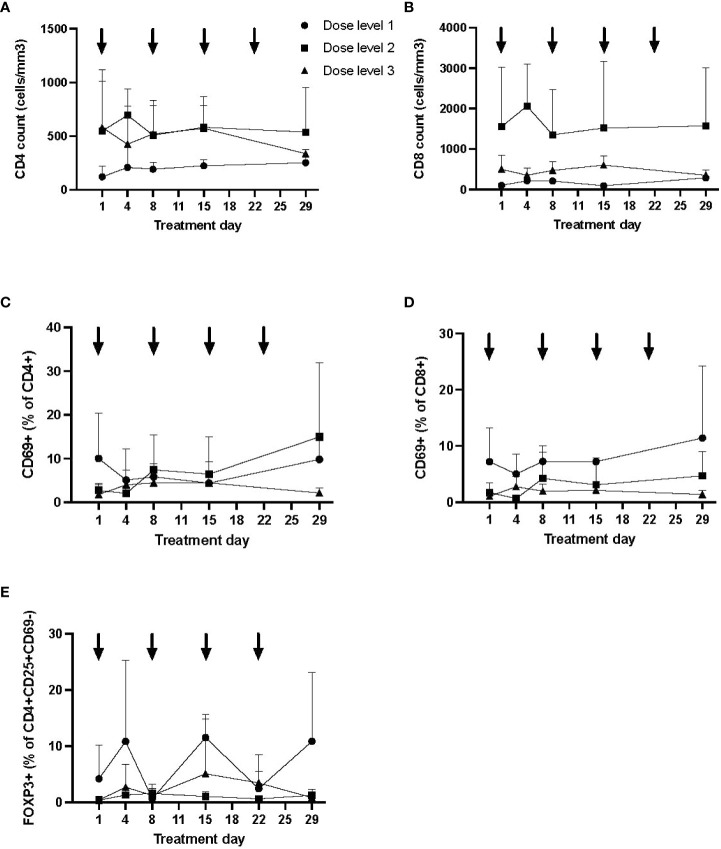
Figure 3.
Longitudinal immune profile following autologous MSC infusion. Flow cytometry was performed to evaluate lymphocyte subsets (CD3+CD4+ and CD3+CD8+; A, B), T-cell activation (CD69+; C, D), and regulatory T cells (E) longitudinally. Data (mean, SD) are shown by dose level, with timing of MSC infusion designated by arrows. The proportion of activated T cells was lowest at day 29 in dose level 3, although T-cell activation was higher at baseline in dose level 1. No significant differences were otherwise seen by dose level in T-cell counts or proportion of regulatory T cells. MSC, mesenchymal stromal cell; SD, standard deviation.

