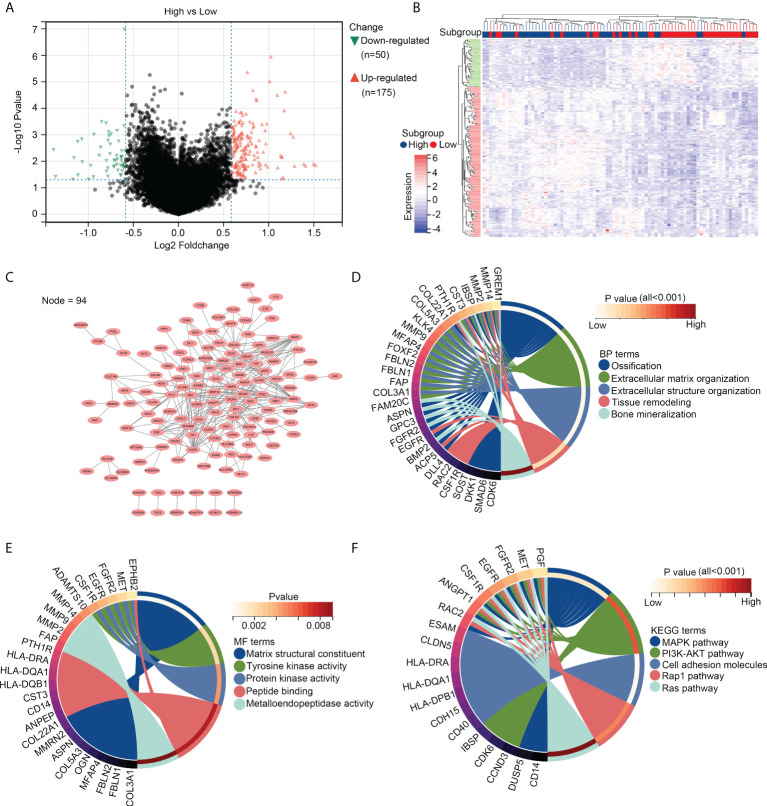
Figure 2.
Genetic characterization of OS tissues with high infiltration of resting dendritic cells. (A) Volcano plot exhibiting the upregulated and downregulated genes in OS tissues between groups with high and low infiltration of resting dendritic cells. (B) Heatmap plot exhibiting the upregulated and downregulated genes in OS tissues between groups with high and low infiltration of resting dendritic cells. (C) PPI network indicating the relationship between the 94 genes associated with the infiltration of resting dendritic cells. (D) Biological process analyses for the 94 genes associated with the infiltration of resting dendritic cells. (E) Molecular function analyses for the 94 genes associated with the infiltration of resting dendritic cells. (F) KEGG analysis for the 94 genes associated with the infiltration of resting dendritic cells.

