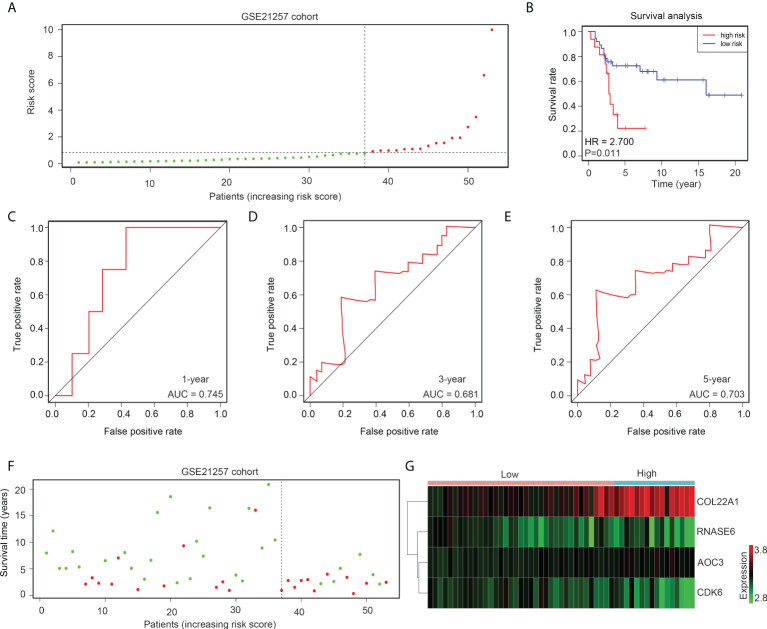
Figure 5.
The risk model exhibits high prognostic value in the GSE21257 verification cohort. (A) OS tissues in GSE21257 were divided into low- and high-risk groups according to median risk scores. (B) Kaplan survival analysis indicated the difference between low- and high-risk group OS tissues in GSE21257. (C–E) ROC analysis of the risk model for the 1-year, 3-year, and 5-year survival rates for OS patients in GSE21257. (F) Alive and death cases between low- and high-risk group OS tissues in GSE21257. (G) Expression of COL22A1, CDK6, RNASE6 and AOC3 between low- and high-risk group OS tissues in GSE21257.

