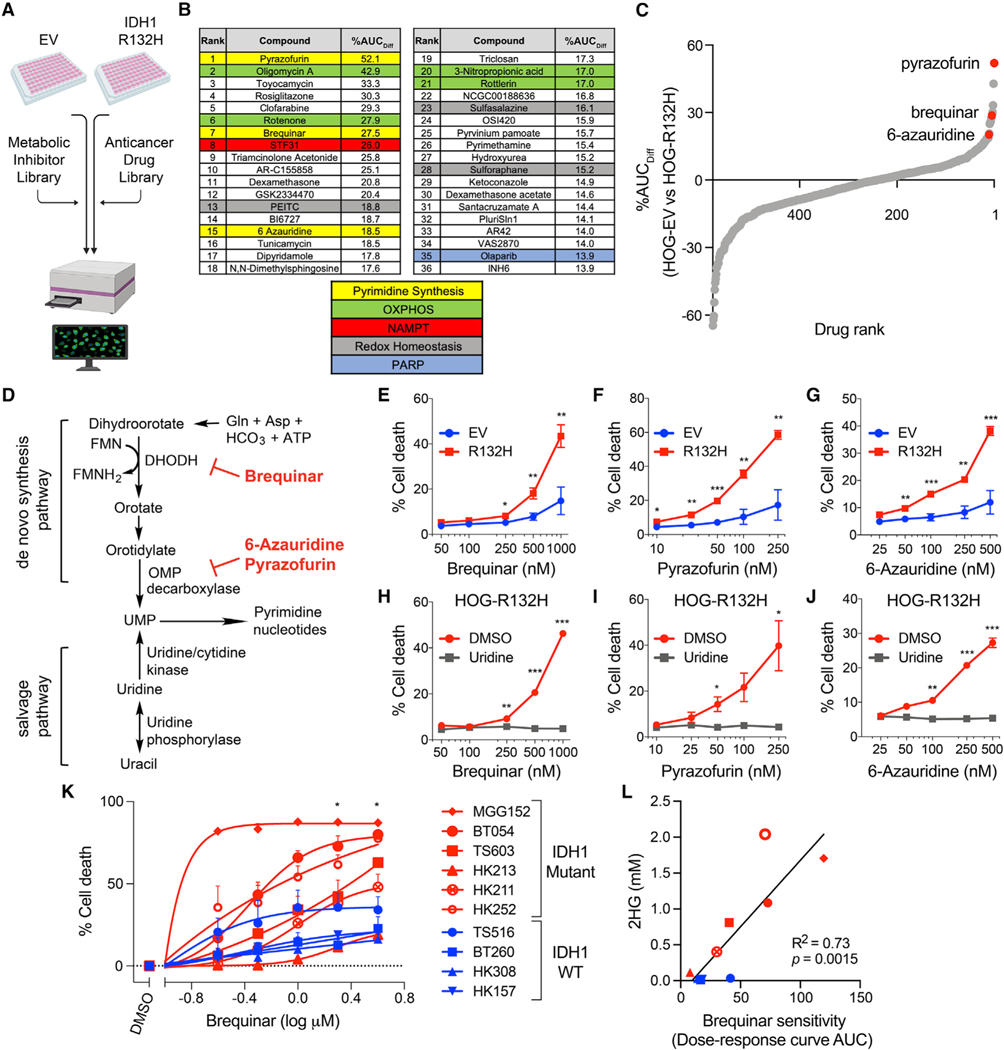
Figure 1. De novo pyrimidine synthesis inhibitors preferentially kill IDH1-mutant glioma cells.
(A) Schema of the multifunctional approach to pharmacologic screening (MAPS) platform drug screen. Percent difference in area under curve (AUC) values (%AUCDiff) in HOG-EV and HOG-R132H cells were calculated for all drugs.
(B) Top hits and related pathways.
(C) Waterfall plot of all drugs ranked by %AUCDiff.
(D) Schematic of de novo and salvage pyrimidine synthesis pathways and targets of indicated hits.
(E–G) Cell death assays of HOG-EV or HOG-R132H cells treated with the indicated drugs (n = 5).
(H–J) Cell death assays of HOG-R132H cells treated with indicated drugs with or without 100 μM uridine (n = 3).
(K) Cell death assays of GSC lines treated with brequinar for two population doublings (n ≥ 3).
(L) Correlation between 2HG levels and sensitivity of GSC lines to brequinar. Symbols and colors are as in (K). For all panels, data presented are means ± SEM; *p < 0.05, **p < 0.01, ***p < 0.001. For (L), p value was determined by simple linear regression analysis. For all others, two-tailed p values were determined by unpaired t test.

