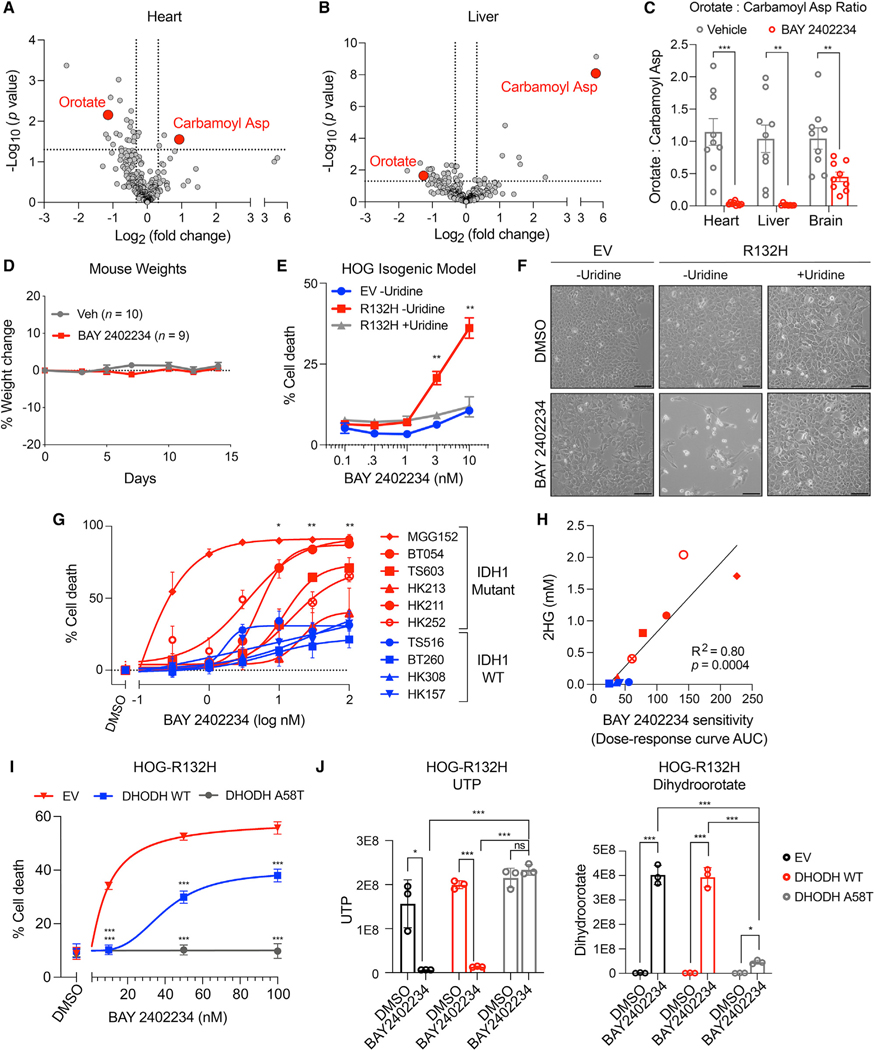
Figure 2. The DHODHi BAY 2402234 is brain-penetrant in mice and selectively kills IDH1-mutant glioma cells.
(A and B) Volcano plot of metabolites in heart (A) and liver (B) of mice treated with BAY 2402234 or vehicle (n = 9 per cohort). Carbamoyl asp = carbamoyl aspartate.
(C) OCAR in tissues of mice treated with BAY 2402234 or vehicle as in (A) (n = 9 per cohort).
(D) Weight changes in mice treated with BAY 2402234 or vehicle.
(E) Cell death assays of HOG-EV or HOG-R132H cells treated with BAY 2402234 with or without 100 μM uridine (n = 3).
(F) Representative photomicrographs of cells in (E). Scale bars, 100 μm.
(G) Cell death assays of GSC lines treated with BAY 2402234 or DMSO for two population doublings (n ≥ 3).
(H) Correlation between 2HG levels and sensitivity of GSC lines to BAY 2402234. Symbols and colors are as in (G).
(I) Cell death assays of HOG-R132H cells expressing EV, DHODH WT, or DHODH A58T treated with BAY 2402234 or DMSO (n = 3).
(J) UTP and dihydroorotate levels in HOG-R132H stable lines treated with 50 nM BAY 2402234 or DMSO (n = 3). For panels (A–E and G), data are means ± SEM; for panels (I and J), data are means ± SD; *p < 0.05, **p < 0.01, ***p < 0.001. For (H), the p value was determined by simple linear regression analysis. For all others, two-tailed p values were determined by unpaired t test.

