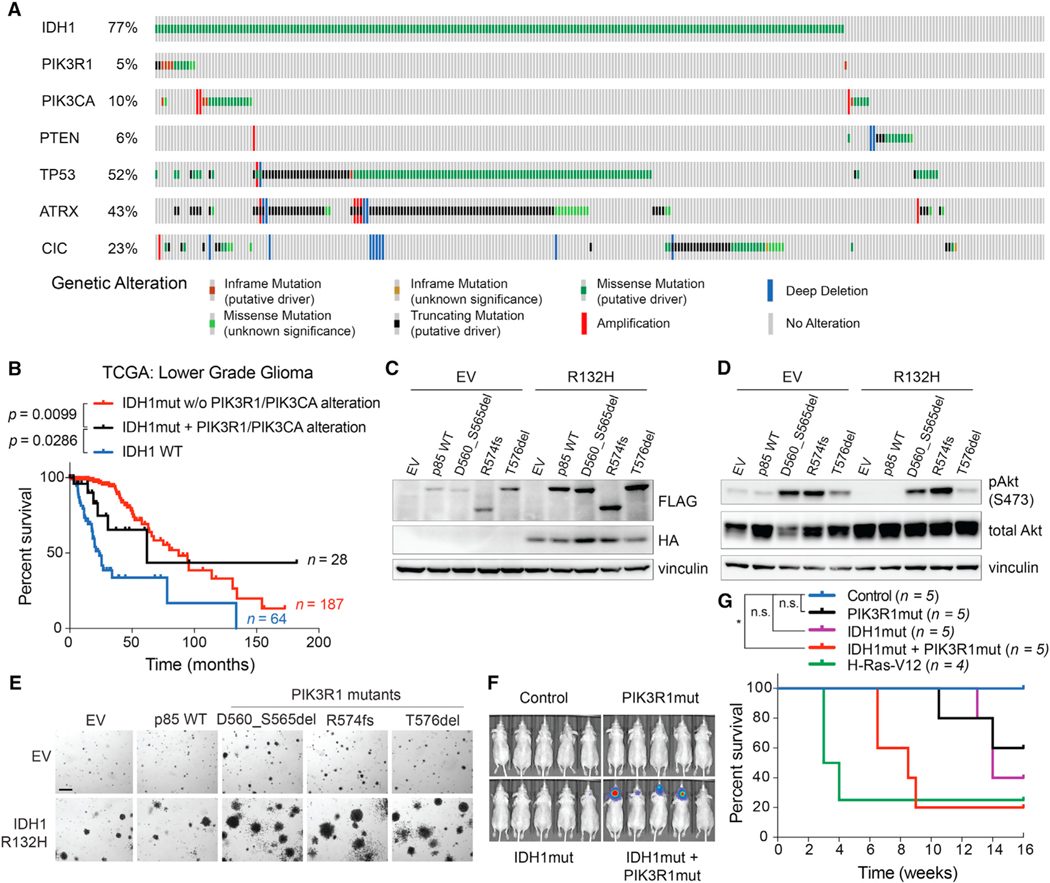
Figure 4. IDH1 and PIK3R1 oncogenes cooperate to transform immortalized astrocytes.
(A) Alterations in the indicated genes in the Brain Lower Grade Glioma TCGA dataset.
(B) Kaplan-Meier curves of glioma patients with the indicated genotypes. Note that the apparent tail of the black curve is driven by a single patient.
(C and D) Immunoblot analyses of NHA cell lines expressing HA-tagged IDH1-R132H (or EV) and FLAG-tagged WT or mutant (D560_S565del, R574fs, or T576del) p85 (protein product of PIK3R1 gene) or the corresponding EV.
(E) Representative anchorage independence assays of NHA cells used in (C) and (D) (n = 5). Scale bar, 100 μm.
(F and G) Bioluminescence imaging (F) and Kaplan-Meier curves (G) of mice after intracranial injection of EV/EV (control), IDH1R132H/EV (IDH1mut), EV/p85D560_S565del (PIK3R1mut), IDH1R132H/p85D560_S565del (IDH1mut + PIK3R1mut), or H-Ras-V12 (positive control) NHA lines. *p < 0.05. n.s., not significant. P values were determined by the log rank test.

