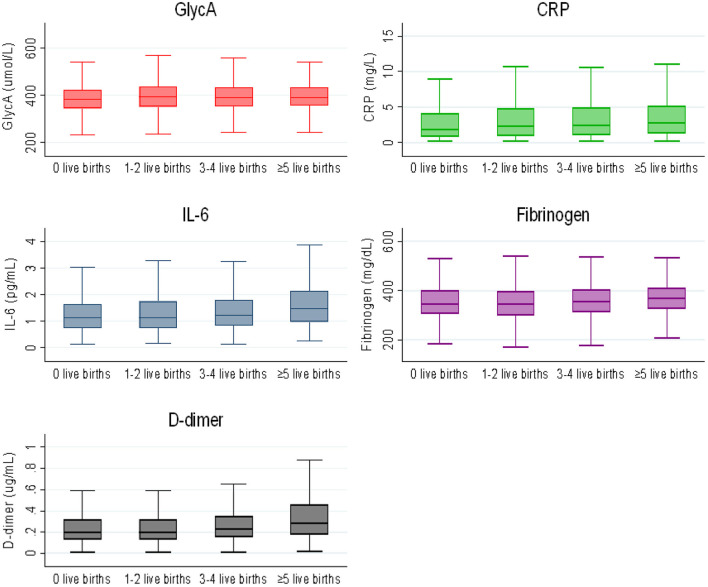
Figure 1.
Box plot of inflammatory markers by parity categories. The lower and upper boundaries of the rectangles denote the 25th and 75th percentiles while the horizontal line within the rectangles is the median. Lines extend from the rectangles to the smallest and largest values within 1.5 × interquartile range.

