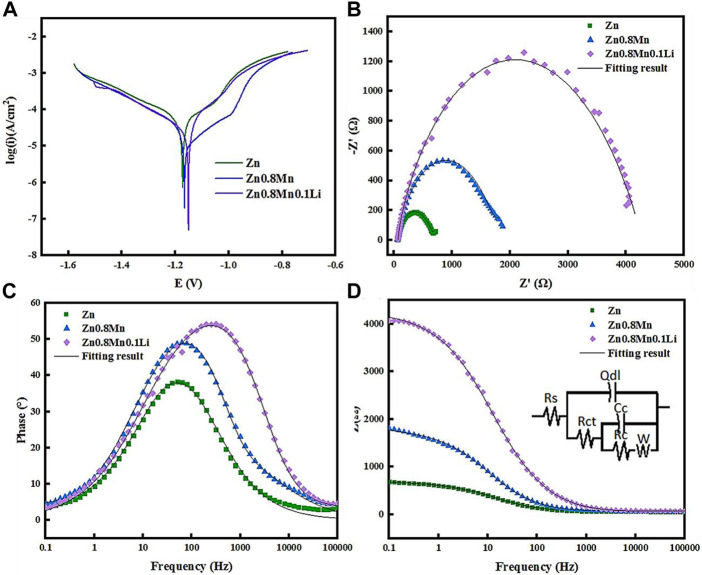
FIGURE 4.
Polarization curves and EIS results of pure Zn and Zn-based alloys in SBF. (A) Potentiodynamic polarization curves. (B) Nyquist plots. (C) Bode plots of phase angle vs. Frequency. (D) Bode plots of |Z| vs. Frequency. The inset in Figure 4D is an equivalent circuit for fitting the EIS spectra.

