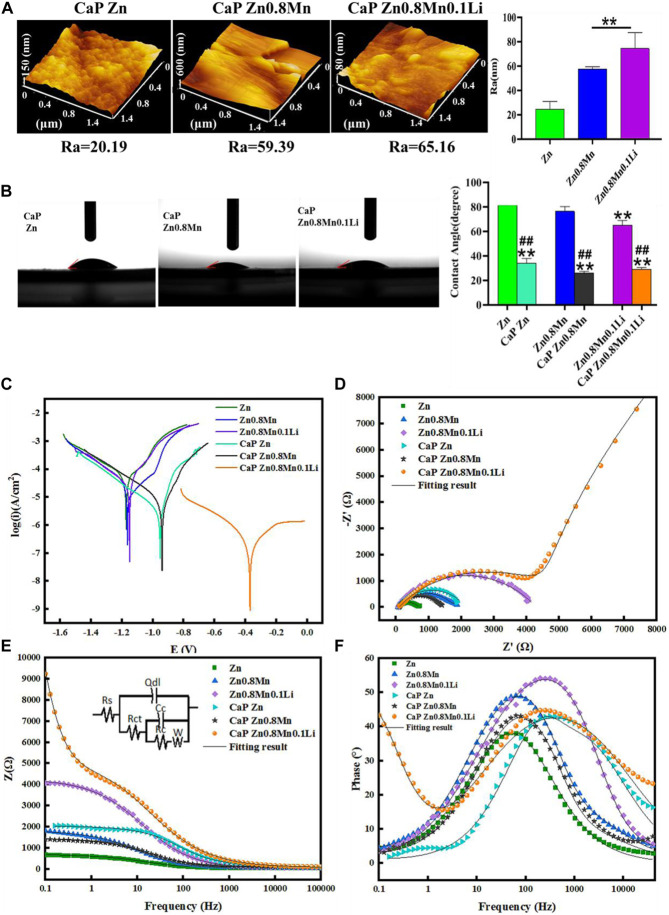
FIGURE 7.
Characterization of CaP-coated Zn, Zn0.8Mn, and Zn0.8Mn0.1Li. (A) The surface roughness of the surfaces obtained by AFM. (B) Water contact angles. (C) Potentiodynamic polarization curves of CaP Zn, CaP Zn0.8Mn, and Zn0.8Mn0.1Li. (D) Nyquist plots. (E) Bode plots of |Z| vs Frequency. The insets in Figure 7E is equivalent circuit for fitting the EIS spectra. (F) Bode plots of phase angle vs Frequency. *p < 0.05 compared to pure Zn, **p < 0.01 compared to pure Zn, ##p < 0.01 compared to no coatings.

