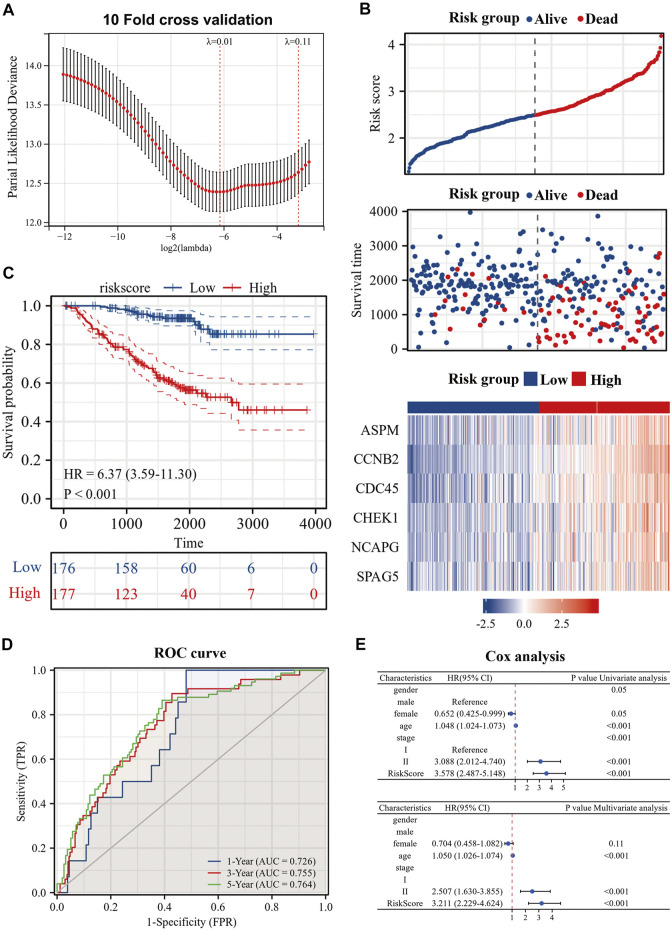
FIGURE 4.
Construction of risk model by six genes. (A) Construction of prognostic signature by Lasso regression and 10-fold cross validation; (B) Risk factor diagram of es-LUAD patients; (C) KM prognostic curve of training group; (D) ROC curve of training group; (E) Univariate Cox analysis and Multivariate Cox analysis of risk score. Lasso: Least absolute shrinkage and selection operator; KM: Kaplan-Meier; ROC: receiver operating characteristic.

