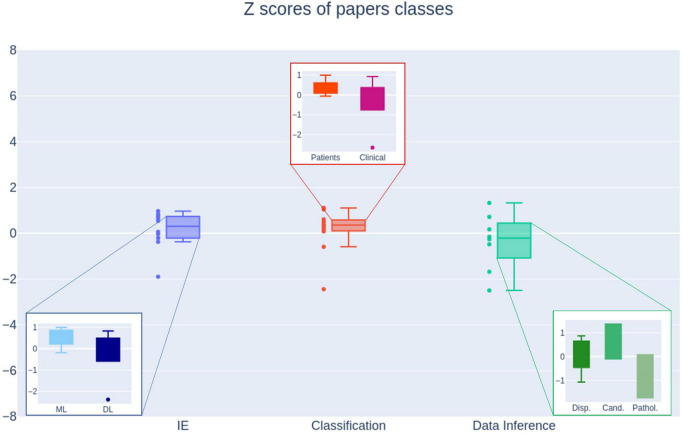
FIGURE 3.
Performance box plot of the NLP methods representing the medians, interquartile ranges, outliers. IE, information extraction; ML, traditional machine learning; DL, deep learning; Patients, patients texts; Clinical, clinical notes; Disp., patients’ disposition; Cand., best candidates; Pathol., specific pathologies.

