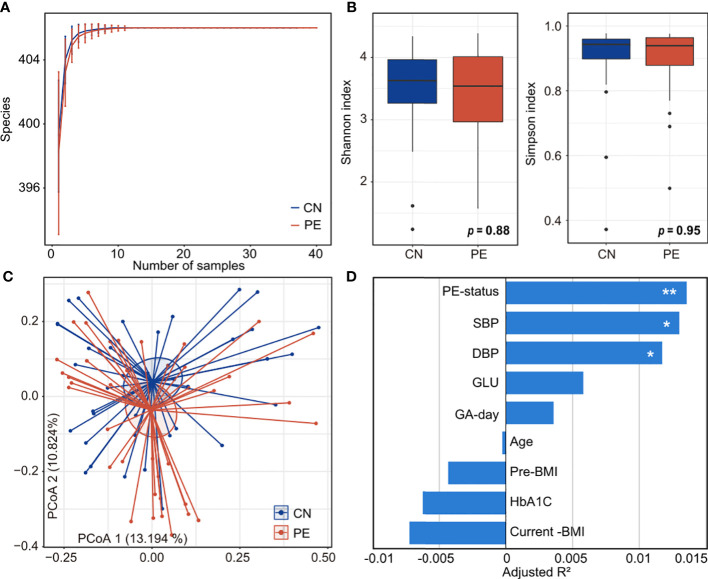
Figure 2.
Comparison of microbial diversity and structure in PE patients and healthy controls. (A) Rarefaction curve analysis of the number of observed species in two groups. The number of species in different groups is calculated based on a randomly selected specific number of samples with 30 replacements, and the median and quartile values are shown. (B) Boxplot shows the Shannon and Simpson diversity indexes of gut microbiota that differ among the two groups. Boxes represent the interquartile range between the first and third quartiles and median (internal line); whiskers denote the lowest and highest values within 1.5 times the range of the first and third quartiles, respectively; and nodes represent outliers beyond the whiskers. (C) PCoA analysis of Bray-Curtis distance based on the composition of gut microbiota, revealing the separation between the PE patients and healthy controls. The location of samples (represented by nodes) in the first two principal coordinates is shown. Lines connect samples in the same group, and circles cover samples near the center of gravity for each group. (D) PERMANOVA analysis showing the effect size of phenotype indexes that contribute to the variance of the overall gut microbiome. Bar plots indicate the explained variation (adjusted R2) of each factor. Adonis test: *, permutated p<0.05; **, permutated p<0.01. SBP, systolic blood pressure; DBP, diastolic blood pressure; GLU, fasting blood glucose; GA-day, gestational age (day); Pre-BMI, pre-pregnancy body mass index.

