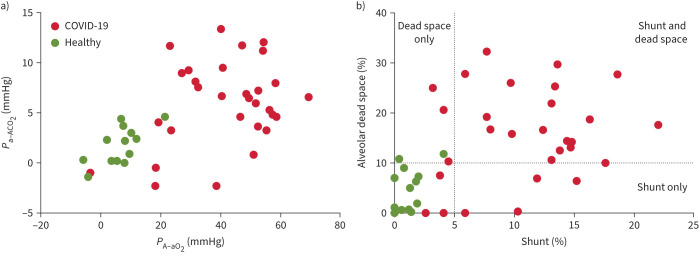
FIGURE 2.
a) Alveolar–arterial partial pressure differences for oxygen (PA−aO2) and carbon dioxide (Pa−ACO2). b) Intrapulmonary shunt and alveolar dead space. Acute COVID-19 patients (n=30) and healthy subjects (n=13). Dotted lines in (b) show 95% upper limits for normal [17].

