FIGURE 4.

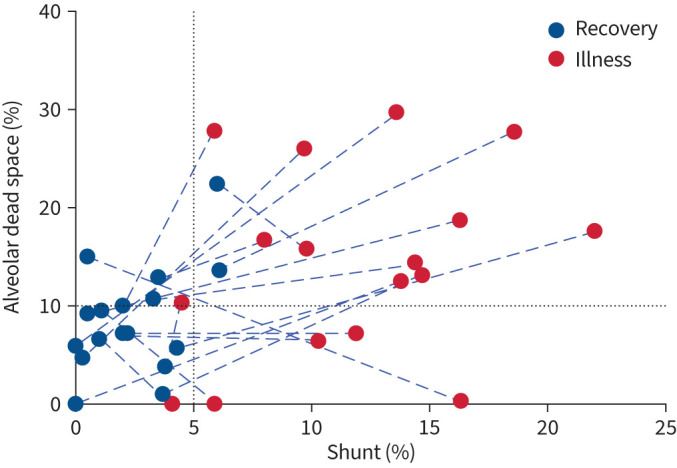
Shunt and dead space trajectories from acute COVID-19 illness to recovery. Blue dashed lines connect paired acute and recovery data (n=17). Black dotted lines show the 95% upper confidence limits of normal.

Shunt and dead space trajectories from acute COVID-19 illness to recovery. Blue dashed lines connect paired acute and recovery data (n=17). Black dotted lines show the 95% upper confidence limits of normal.