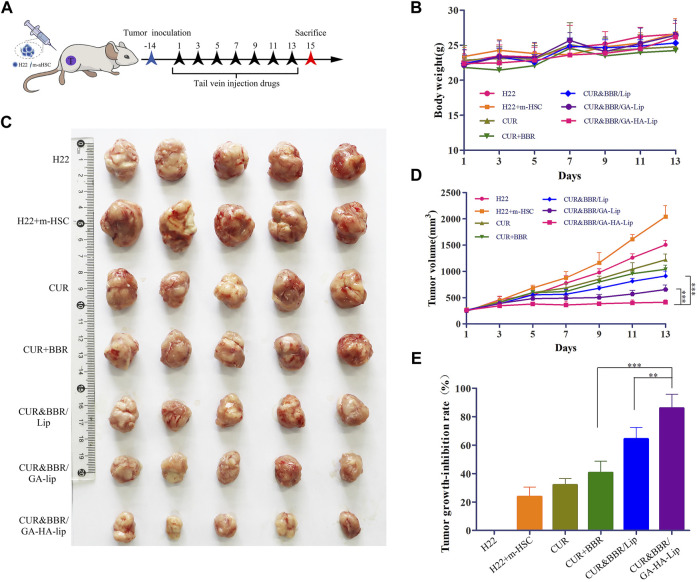
FIGURE 6.
The anti-tumor evaluation of the H22+m-HSC tumor-bearing mice model. (A) Scheme of the strategy for the H22+m-HSC tumor-bearing mice model. (B) Body weight. (C) Images of tumor tissue in different treatment groups. (D) The curve of tumor volume during treatment. (E) Analysis of the tumor inhibition rate of different preparations.

