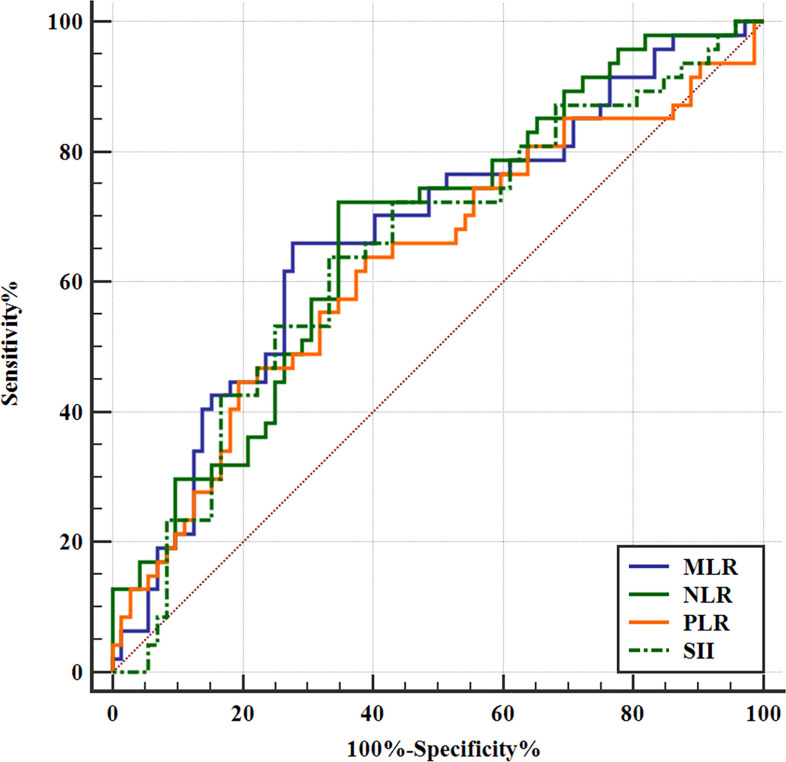
Figure 1.
Receiver operating characteristic (ROC) curves of inflammatory markers for predicting binary stage of SCLC. NLR, PLR, MLR, and SII could predict the binary stage of SCLC. The ROC curve analysis of the NLR to predict ED-SCLC. With an NLR of 2.64 as the threshold, the sensitivity and specificity in the prediction of ED-SCLC were 72.34% and 65.28%, respectively. The AUC was 0.672 (95% confidence interval [CI]: 0.580–0.756; p = 0.0006). The ROC curve analysis of the PLR to predict ED-SCLC. With an PLR of 170.67 as the threshold, the sensitivity and specificity for the prediction of ED-SCLC were 44.68% and 80.56%, respectively. The AUC was 0.628 (95% CI: 0.535–0.715; p = 0.0178). The ROC curve analysis of the MLR to predict ED-SCLC. With an MLR of 0.31 as the threshold, the sensitivity and specificity for the prediction of ED-SCLC were 65.96% and 70.83%, respectively. The AUC was 0.669 (95% CI: 0.577–0.753; p = 0.0010). The ROC curve analysis of the SII to predict ED-SCLC. With an SII of 583.1 as the threshold, the sensitivity and specificity for the prediction of ED-SCLC were 63.83% and 66.67%, respectively. The AUC was 0.646 (95% CI: 0.553–0.731; p = 0.0055).

