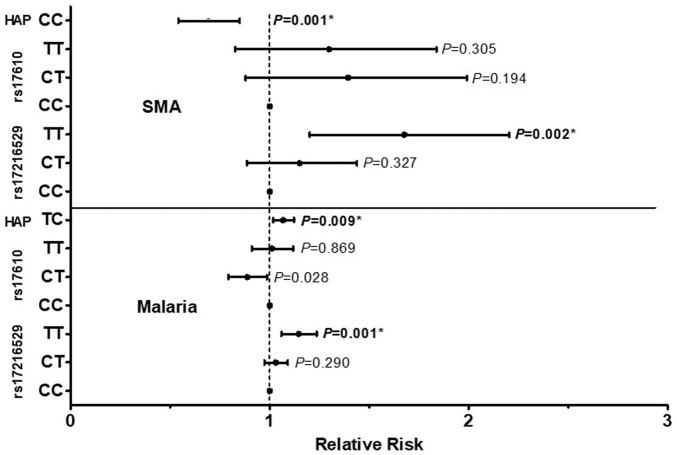
FIGURE 3.
A total of 1,546 study participants were enrolled into the study. These were grouped into three categories at enrollment: aparasitemic (n = 288), uncomplicated malaria (UM, Hb ≥ 5.0 g/dl, n = 971) and SMA (Hb < 5.0 g/dl, n = 287). The influence of C5 genotypes/haplotypes on the number of malaria and SMA episodes throughout the study period was determined by a Poisson rate regression (R glm function, family = Poisson), with the (logarithm of) age at the patients last visits being the offset variable (rate regression). A forward-backward model selection that minimize the AIC was used in the Poisson regression. The first covariate inputs into the model were either C5 genotypes or haplotypes. Thereafter, additional covariates which included age at enrollment, sex, HIV, cohort, sickle cell status (sickle trait and sickle cell disease) glucose six phosphate deficiency (G6PD) and α thalassemia were entered into the model. The figure shows relative risk (midline dot) and 95% confidence intervals as determined by log-linear regression analyses, adjusting for age at enrollment, sex, HIV, cohort and sickle cell status (sickle trait and sickle cell disease). This cohort for followed quarterly for a period of 36 months *Significant after Bonferroni-Holm correction.

