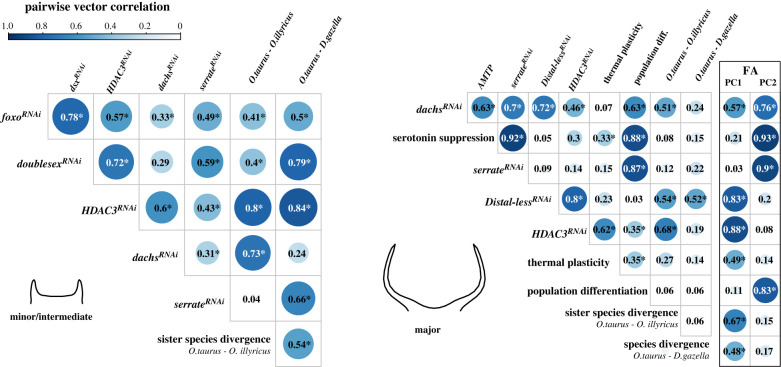
Figure 4.
Pairwise correlations between the effects of functional genetic manipulations, plasticity, evolutionary divergence and FA on horn shape (PC1 (explaining 39.4% of the total variation) and PC2 (24.8%) of the covariance matrix of the FA shape component). Only manipulations that had significant effects in the respective morph are shown. Correlations larger than expected under a uniform distribution in 30-dimensional space are indicated with an asterisk (see [36]). (Online version in colour.)

