Abstract
A simple strategy to rapidly detect glucose was developed by utilizing core (Fe3O4)–shell (Pt) magnetic nanoparticles (Fe3O4@Pt NPs) as a nanoenzyme and a paper-based colorimetric sensor. In the presence of H2O2, Fe3O4@Pt NPs catalyze the redox reaction of 3,3′,5,5′-tetramethylbenzidine (TMB) and generate a colour change from colourless to blue. On this basis, a colorimetric glucose sensing method assisted by glucose oxidase (GOx) was developed. Under the optimal conditions, the detection limits of the proposed assay for H2O2 and glucose were 0.36 µM and 1.27 µM, respectively. Furthermore, the fabricated colorimetric method was successfully applied to analyze glucose concentrations by using a paper device as a measuring platform without a spectrometer. In addition, this method exhibited satisfactory recovery for glucose detection in human serum samples and urine samples, which satisfied the requirements for normal detection of real samples. This study provides a good candidate for health monitoring of glucose and also expands the applications of nanoenzymes and paper-based colorimetric assays in point-of-care testing.
Keywords: Fe3O4@Pt NPs, nanoenzyme, glucose, colorimetric, paper-based device
1. Introduction
Diabetes is a chronic disease associated with various terrible complications, such as blindness, kidney failure, heart attacks, strokes and lower limb amputations [1]. Hence, it is vital to monitor and control the blood sugar level and urine sugar level to prevent and control the occurrence of diabetes and its complications. It is therefore very important to design a simple, convenient and easy-to-operate glucose sensor, which has become the centre of attention for researchers, clinicians and patients [2,3]. Scholars have developed a variety of methods for the determination of glucose [4], including electrochemistry [5–8], colorimetry [9–13], fluorimetry [14–16], chemiluminescence [17,18] and surface-enhanced Raman spectroscopy [19–22]. Among these techniques, colorimetric techniques have attracted considerable attention owing to their simple operation, ease of use, high visual sensitivity and low cost. The typical colorimetric biosensor for glucose detection is designed based on the activity of biological enzymes [23,24]. Nevertheless, the catalytic activities of natural enzymes are easily inhibited, and the enzymes are digested by proteases, which results in poor stability and reduced accuracy, cannot better match the simplicity and convenience of real-time detection, and limits their application. Therefore, a method instead of natural enzymes is needed for the detection of glucose, particularly in the application of point-of-care testing.
Nanoenzymes are artificial nanomaterials that can imitate the activities of natural enzymes [25–27]. Compared to natural enzymes, nanoenzymes have many irreplaceable advantages, such as high stability, low cost, adjustable catalytic activity and convenient modification [28–30]. It has been found that Fe3O4 nanoparticles have inherent peroxidase-like activity [31,32]. The catalytic mechanism of Fe3O4 might be explained by a ping-pong reaction mechanism. Fe3O4 could combine with the first substrate H2O2 to generate intermediate •OH, which could catch hold of one H+ from the hydrogen donor such as TMB [33]. Platinum is one of the most ideal shells with which to protect Fe3O4 nanoparticles from damage and aggregation [34]. Platinum (Pt) is a transition metal exhibiting chemical inertness and stability in air or a humid environment [35], and Pt NPs also have peroxidase-like activity [36–38]. This may be caused by the base-like decompositions of H2O2 on the surfaces of Pt NPs [33]. Fe3O4@Pt hybrid nanoparticles make full use of these two materials (precious metal and magnetic material) [39] and show better catalytic performance than individual metals through synergistic effects [40].
In this research, we constructed a simple approach to detect glucose by preparing uniformly dispersed core (Fe3O4)–shell (Pt) magnetic nanoparticles (Fe3O4@Pt NPs) as peroxidase mimetics, with which a paper-based colorimetric sensor is used. The strong colorimetric signal that appears on the paper is sufficient to distinguish normal (healthy) and hyperglycemic (diabetes) concentrations with the naked eye. The experimental method has the advantages of simple preparation and environmental protection and has broad prospects for application for rapid and timely detection of glucose.
2. Material and methods
2.1. Materials and apparatus
Glucose, sucrose, fructose, lactose and maltose were obtained from Macklin, Inc. (Shanghai, China). Chloroplatinic acid (H2PtCl6·6H2O) and 3,3′,5,5′-tetramethylbenzidine (TMB) were purchased from Aladdin Chemistry Co., Ltd. (Shanghai, China). Ferric chloride hexahydrate (FeCl3·6H2O), anhydrous sodium acetate, ethylene glycol (EG), sodium borohydride (NaBH4), sodium citrate dihydrate, 30% H2O2 and absolute ethanol were supplied by Sinopharm Chemical Reagent Co., Ltd. (Shanghai, China). Tween 20 was obtained from Sigma–Aldrich Co., Ltd. (Shanghai, China). All chemicals were of analytical grade and used without further purification. The water used in this experiment was purified with a Milli-Q water system (18.2 MΩ/cm).
Serum and urine were collected by the Fujian Maternal and Child Health Hospital, Affiliated Hospital of Fujian Medical University. The in vitro experimental protocol was approved by the Ethics Committee of Fujian Medical University (approval number: 2019021; approval date: March 8, 2019), and the volunteers provided consent.
X-ray diffraction (XRD) patterns of the products were obtained on an Ultima IV multipurpose X-ray diffraction system (Japan). X-ray photoelectron spectroscopy (XPS) was conducted with a Thermo Scientific K-Alpha spectrometer (Thermo Ltd. USA). Transmission electron microscopy (TEM) was performed on an FEI Tecnai G2 F20 (FEI Co. Ltd. USA) by placing a drop of sample solution on a TEM copper grid. Energy dispersive spectrometry (EDS) was used to determine the element ratios of iron and platinum. Fourier transform infrared (FTIR) spectra were obtained from a Fourier transform infrared spectrometer (Bruker VERTEX 70 & ALPHA, Bruker Ltd. Germany). Magnetic measurements were performed using a 7404 vibrating sample magnetometer (Lake Shore, Ltd., USA). The hydrodynamic sizes and zeta potentials of particles were measured on a Malvern Zetasizer ZEN 3700 (Malvern Panalytical Ltd., U.K.). UV–vis spectra and time-dependent absorbance changes were collected on an Infinite 200 Pro spectrophotometer (Tecan Ltd., Austria).
2.2. Synthesis of nanoenzymes
Fe3O4 NPs were synthesized by a reported one-step hydrothermal method [41] with minor modifications. In brief, 1.0 g of FeCl3·6H2O was dissolved in 35 ml of glycol in a 100-ml flask, and 0.415 g of sodium citrate dihydrate and 2.4 g of anhydrous sodium acetate were added. After all reactants were dissolved by vigorous stirring, the solution was transferred to a 50-ml stainless-steel autoclave lined with Teflon and heated to 200°C for 10 h. After cooling, the obtained black precipitate was washed with water and ethanol 6 times and dried in a vacuum oven at 50°C for 10 h.
Fe3O4@Pt NPs were synthesized. 12 ml of 1 mg ml−1 Fe3O4 NPs, 200 µl of 2% H2PtCl6·6H2O and 38 ml of water were stirred together under a nonmagnetic agitator in darkness for 30 min. Then, 500 µl of freshly prepared 0.5 mg ml−1 NaBH4 was added. After stirring for 8 min, 0.2 g of sodium citrate dihydrate was added to the solution with a further 5 min of stirring. The resulting brown–black solution was washed with water 6 times. The obtained Fe3O4@Pt NPs were stored at 4°C.
2.3. Kinetic parameters
The absorption spectra at intervals of 60 s were recorded by a multi-mode absorbance microboard reader (TECAN, Infinite 200 Pro), and the reaction kinetics of the catalytic oxidation of TMB were studied. Unless otherwise stated, the reaction was performed at room temperature. 50 µl 20 µg ml−1 Fe3O4 NPs or Fe3O4@Pt NPs were added to 100 µl of HAc-NaAc buffer (2 mM, pH 4.0) in the presence of different concentrations of TMB or H2O2.
2.4. Hydrogen peroxide detection
In colorimetric experiments for the detection of H2O2, 100 µl of 1.6 mM TMB, 50 µl of 20 µg ml−1 Fe3O4@Pt NPs, 100 µl of HAc-NaAc buffer (2 mM, pH 4.0) and 100 µl of different concentrations of H2O2 solutions (0.005–1 mM) were sequentially added to the vials. Then, the mixed solution was incubated at 35°C for 30 min. The colour change of the solution was observed by the naked eye or measured by a microplate reader.
To verify the long-term storage stability of Fe3O4@Pt NPs, we measured the colour change of the solution by the detection of 1 mM H2O2 using the above method every two days for 30 days.
2.5. Glucose detection
For glucose determination, 100 µl of different concentrations of glucose were first incubated with 40 µl of 2.5 kU ml−1 glucose oxidase (GOx) in PBS (137 mM NaCl, 2.7 mM KCl, 2 mM KH2PO4, 10 mM Na2HPO4, pH 7.4) at 37°C for 30 min. After that, 50 µl of 20 µg ml−1 Fe3O4@Pt NPs, 100 µl of 1.6 mM TMB and 100 µl of HAc-NaAc buffer were added to the glucose reaction solution and incubated at 35°C for 30 min. The spectra of the final solution were recorded by a microplate reader.
2.6. Preparation of a paper-based platform
First, the filter paper was cut into small discs of 1 cm in diameter. Then, 5 µl of glucose and 5 µl of 2.5 kU ml−1 GOx were dropped on filter paper and allowed to react for 30 min, and 5 µl of 20 µg ml−1 Fe3O4@Pt NPs and 5 µl of 1.6 mM TMB were added. After reaction for 10 min, colour images were captured by camera, and grayscale intensity analysis was performed with ImageJ software.
3. Results and discussion
3.1. Detection principle
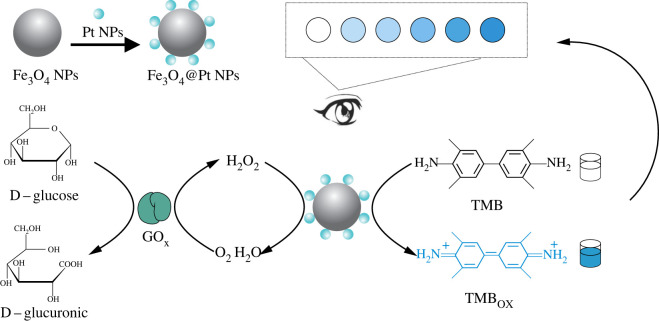
Both Fe3O4 NPs and Pt NPs have inherent peroxidase-like activity and show better catalytic performance than the individual metals alone because of a synergistic effect, and they effectively catalyze the oxidation of TMB by hydrogen peroxide to produce a colour change [42]. The degree of colour rendered by TMB was proportional to the concentration of H2O2. The detailed principle of this method is shown in scheme 1. In solution, glucose was first oxidized by glucose oxidase (GOx) to form H2O2. By adding Fe3O4@Pt NPs and TMB solution, Fe3O4@Pt NPs effectively catalyzed the oxidation of TMB by H2O2, causing TMB to change from colourless to blue in the solution, which provided a sensing platform for visual detection of H2O2 and glucose.
Scheme 1.
Construction of Fe3O4@Pt NPs and the H2O2 and glucose detection assay using Fe3O4@Pt NPs.
3.2. Characterization of Fe3O4 NPs and Fe3O4@Pt NPs
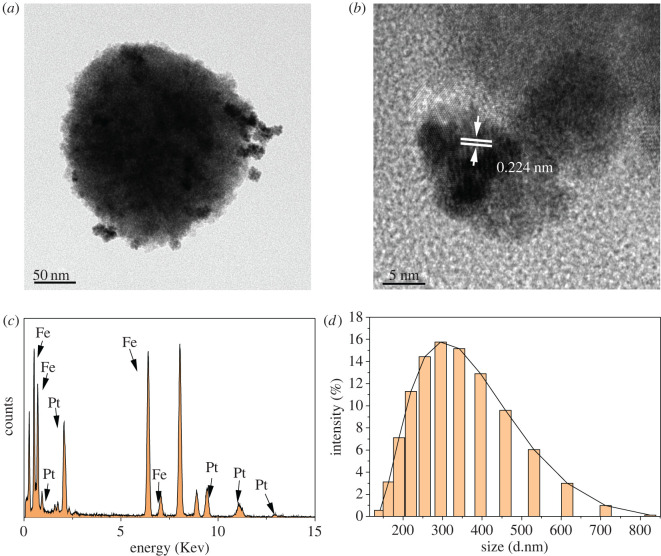
TEM images and particle size distribution curves for the prepared Fe3O4 NPs and Fe3O4@Pt NPs are shown in electronic supplementary material, figure S1 and figure 1. As shown in electronic supplementary material, figure S1A, B, Fe3O4 NPs were spherical, the mean particle size was 239.8 nm (electronic supplementary material, figure S1D). The nanoparticles were polycrystalline clusters with a lattice fringe spacing of 0.48 nm (electronic supplementary material, figure S1B), which was consistent with the (111) crystal plane of the cubic spinel structure. Figure 1a,b shows TEM data for Fe3O4@Pt NPs, in which the core and shell components could easily be distinguished by the difference in brightness. The Fe3O4@Pt NPs were indeed monodisperse spherical particles with a mean particle size of 281.3 nm (figure 1d). The lattice fringe spacing was 0.224 nm (figure 1b), which was consistent with the crystalline plane of Pt. Figure 1b shows that the Pt NPs were uniformly distributed on the core of the Fe3O4 NPs, and the diameter of the Pt NPs was approximately 7.75 nm. According to the chemical compositions of randomly selected Fe3O4 NPs and Fe3O4@Pt NPs analysed by energy dispersive spectrometry, the atomic ratio of Fe:Pt was 1.95:1 (electronic supplementary material, figure S1C and figure 1c).
Figure 1.
(a) Low- and (b) high-magnification TEM images of Fe3O4@Pt NPs. (c) EDS spectra of Fe3O4@Pt NPs. (d) Size distribution of Fe3O4@Pt NPs.
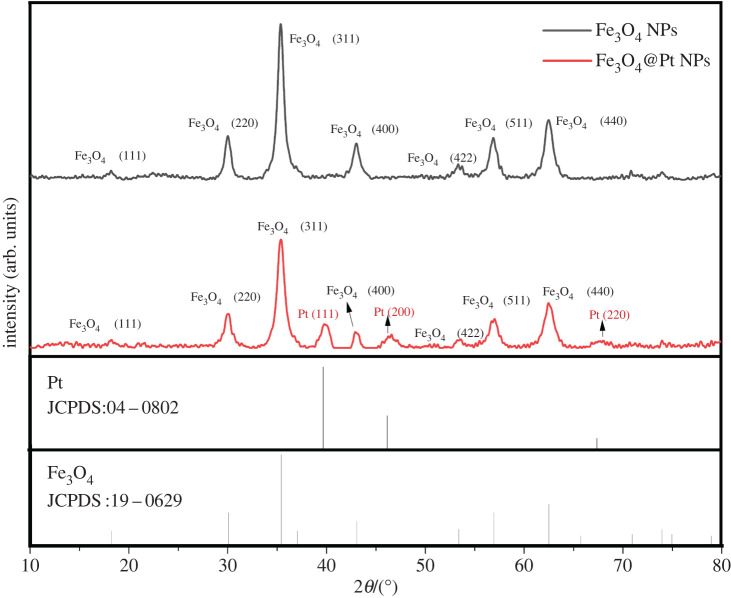
The XRD patterns of Fe3O4 NPs and Fe3O4@Pt NPs are shown in figure 2. The diagram shows diffraction peaks at 2θ = 18.66°, 30.21°, 35.52°, 43.27°, 53.64°, 57.06° and 62.70°, which correspond to the (111), (220), (311), (400), (422), (511) and (440) planes, respectively, indicating that the sample was highly crystalline Fe3O4 NPs with a face centered cubic (FCC) structure (JCPDS 19-0629) for the spinel structure. The diffraction peaks at 2θ = 39.78°, 46.35° and 67.48° corresponded to the (111), (200) and (220) planes, respectively, of Pt (JCPDS 04-0802). The XRD results confirmed the successful synthesis of Fe3O4@Pt NPs.
Figure 2.
XRD patterns of Fe3O4 NPs and Fe3O4@Pt NPs.
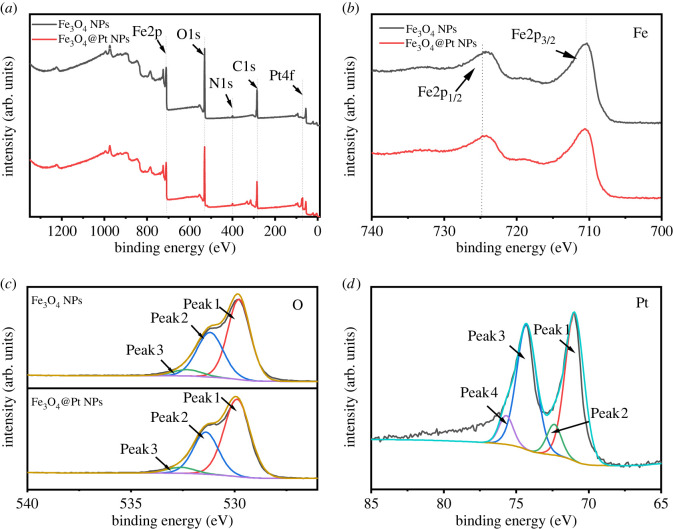
The XPS spectra of Fe3O4 NPs and Fe3O4@Pt NPs are shown in figure 3. Figure 3a shows the full XPS spectra for the Fe3O4 NPs and Fe3O4@Pt NPs. The main elements on the surface of the sample were Fe, O, C, N and Pt. XPS results for the Fe3O4 NPs and Fe3O4@Pt NPs catalysts are shown in figure 3b–d. In the Fe 2p X-ray photoelectron spectrum of Fe3O4 (figure 3b), the peaks at 711.2 eV and 724.6 eV could be attributed to Fe 2p3/2 and Fe 2p1/2, respectively, which indicates that Fe3O4 NPs were the source of Fe, which was very close to the value of Fe3O4 published in the literature [43]. The O 1s spectra of Fe3O4 NPs and Fe3O4@Pt NPs could be divided into three peaks (figure 3c). The O 1s spectrum of Fe3O4 NPs has a maximum peak at 529.8 eV, which belongs to the Fe-O bond [44]. Peak 2 (≈531.2 eV) was attributed to OH groups on the surface of Fe3O4 and/or oxygen in the oxygen vacancy, and peak 3 (≈532.3 eV) indicated adsorption of H2O from air on the surface of the Fe3O4 NPs carrier.
Figure 3.
(a) XPS spectra of Fe3O4 NPs and Fe3O4@Pt NPs. High resolution peak-fitting XPS spectra of (b) Fe 2p, (c) O 1s, and (d) Pt 4f.
Figure 3d shows the Pt 4f XPS spectrum of Fe3O4@Pt NPs. After curve fitting, the spectrum consisted of two pairs of peaks: peak 1 ≈ 71.0 eV, peak 3 ≈ 74.3 eV, peak 2 ≈ 72.4 eV and peak 4 ≈ 75.7 eV, which belong to Pt(0) and Pt2+, respectively [45]. The XPS results were consistent with those from TEM, XRD and EDS mapping.
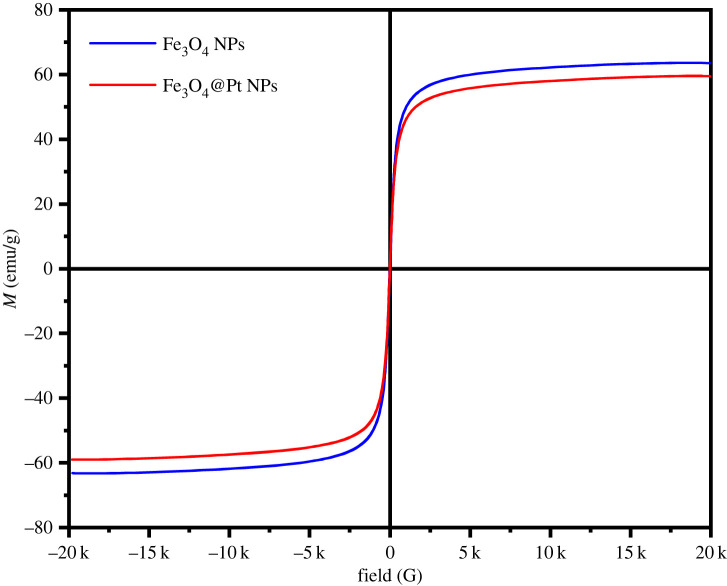
Figure 4 shows the hysteresis loops of Fe3O4 NPs and Fe3O4@Pt NPs measured at room temperature. These results showed that the hysteresis loops had almost no hysteresis and coercivity. The test results showed that the saturation magnetizations of Fe3O4 NPs and Fe3O4@Pt NPs were 63.61 emu/g and 59.57 emu g−1, respectively, which showed that binding of Pt NPs had little effect on the magnetic properties. It was reported in the literature that the magnetic particles showed typical superparamagnetism because the particles were composed of ultrafine magnetite nanocrystals [46]. Under the action of an external magnetic field, the prepared Fe3O4@Pt magnetic particles actively responded to the magnetic field and were attracted by the magnetic field; however, once the external magnetic field was withdrawn, the particles themselves had no residual magnetism. This superparamagnetism is very important for magnetic separation and the manufacture of renewable enzyme reactors.
Figure 4.
Magnetic hysteresis curves of Fe3O4 NPs and Fe3O4@Pt NPs.
3.3. Feasibility analysis and kinetic analysis
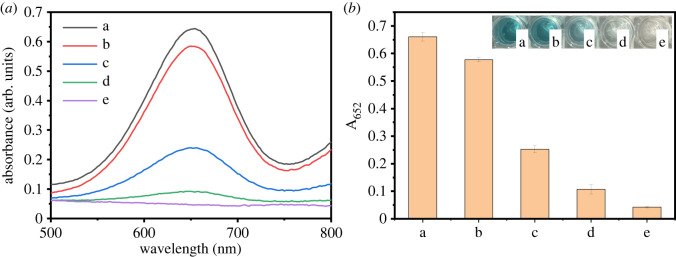
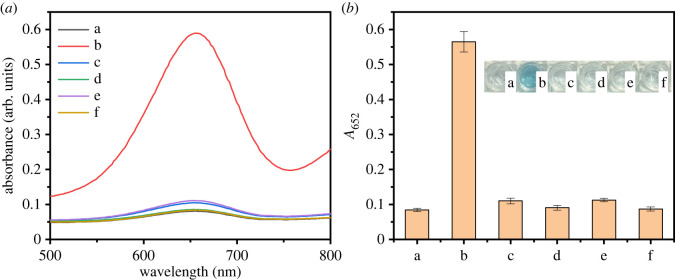
To verify the inherent catalytic potential of Fe3O4@Pt NPs in catalysis, the following experiments were performed. As shown in figure 5, when there was no TMB or H2O2, the solution was almost colourless, and the absorbance in the measured range was very low. When TMB and H2O2 were present at the same time, the Fe3O4@Pt NPs solution, Pt NPs solution (the synthesis method of Pt NPs was based on the literature method [47]) and Fe3O4 NPs solution were blue (as shown in the illustration of figure 5b), the absorption peak was at 652 nm, and the absorbance intensity changed obviously. The peroxidase-like activity of Fe3O4@Pt NPs was 1.2 times and 2.6 times stronger than that of Pt NPs and Fe3O4 NPs, respectively. Such catalytic enhancement could be attributed to a synergetic effect that occurred at the interfaces of Pt NPs and the Fe3O4 NPs that support the heterostructure.
Figure 5.
UV–vis absorption spectra (the inset shows the corresponding colorimetric photographs) of sodium citrate buffer (pH 4.0) containing 1 mM H2O2 and 1.6 mM TMB in the presence of Fe3O4@Pt NPs (20 µg ml−1) (a), Fe3O4 NPs (20 µg ml−1) (b) and Pt NPs (20 μg ml−1) (c). The control group constituted the same reaction system but without TMB (d) and H2O2 (e).
To further study the kinetics of Fe3O4@Pt NPs catalysis, the steady-state kinetic parameters (Km and Vmax) of Fe3O4@Pt NPs in reactions with H2O2 or TMB substrates were determined. As shown in electronic supplementary material, figure S2, when using TMB or H2O2 as a substrate, the enzyme activity conformed to typical Michaelis–Menten kinetics. In addition, Michaelis–Menten curves (electronic supplementary material, figure S2A, C) and Lineweaver-Burk diagrams (electronic supplementary material, figure S2B, D) for H2O2 and TMB were obtained over a certain concentration range. In addition, the initial maximum reaction rate (Vmax) and Michaelis constant (Km) of the Fe3O4@Pt hybrid NPs were calculated by using the double reciprocal Lineweaver-Burk diagram based on the following function:
where V is the initial velocity, and [C] is the substrate concentration. Km is a well-known important index for catalytic materials and can be used to determine the catalytic activity and affinity between enzymes and substrates. Electronic supplementary material, figure S2C, D shows the catalytic activities of H2O2 and TMB substrates and their corresponding double reciprocal curves. The kinetic parameters, including the Michaelis constant (Km) and maximum reaction rate (Vmax), were obtained from the double reciprocal plot. Generally, a smaller Km corresponds to stronger affinity between enzyme and substrate. As shown in electronic supplementary material, table S1, the Km value for the reaction of Fe3O4@Pt NPs (95.6 mM) with H2O2 was higher than that of HRP (3.7 mM), which indicates that the affinity of Fe3O4@Pt NPs for H2O2 was weaker than that of HRP, and Fe3O4@Pt NPs require more H2O2 to depict the same peroxidase activity as HRP. Fe3O4@Pt NPs (0.2 mM) and TMB had similar Km values to HRP (0.4 mM), which indicates that the affinity of Fe3O4@Pt NPs for TMB was close to that of HRP. The obtained results were identical to those in the literature [48].
3.4. Optimization of experimental conditions
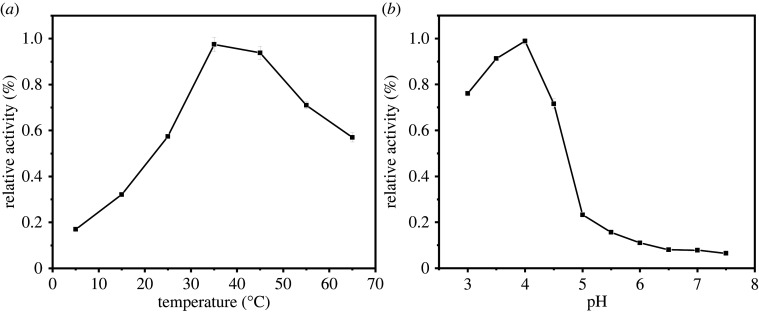
To better optimize the catalytic performance of the Fe3O4@Pt NPs reactions, the catalytic activity was studied at different pH values and temperatures. As shown in figure 6, the relative activity of Fe3O4@Pt NPs increased when the temperature increased from 20°C to 35°C and decreased when the temperature increased to 65°C (figure 6a), which indicates that the optimal temperature for nanoparticles is 35°C. The decrease in peroxidase-like activity might be due to the morphological change/losses of Fe3O4@Pt NPs at high temperature or the accelerated decomposition rate of H2O2 to O2 and H2O. Meanwhile, the relative activity of Fe3O4@Pt NPs increased when the pH was increased from 3.0 to 4.0 and decreased from pH 4.0 to 7.5 (figure 6b). Therefore, the optimal pH for the activity of the separated nanoparticles is pH 4.0. Therefore,35°C and pH 4.0 were selected for the subsequent Fe3O4@Pt NPs analysis.
Figure 6.
Influence of temperature (a) and pH (b) on the enzyme activity for a solution containing 1 mM H2O2 and 1.6 mM TMB and Fe3O4@Pt NPs (20 µg ml−1).
3.5. Stability test
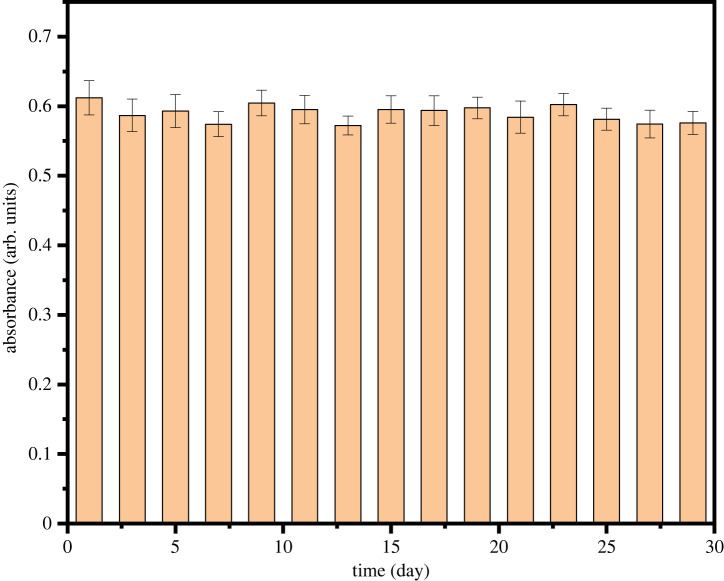
Figure 7 shows the long-term storage stability of Fe3O4@Pt NPs. No apparent changes were observed in the absorption peak at 652 nm within 30 days, which indicates that Fe3O4@Pt NPs have good long-term storage stability.
Figure 7.
Stability tests of Fe3O4@Pt NPs.
3.6. Specificity test
To further study the specificity of this method, blank samples, sucrose, fructose, lactose and maltose were selected for control experiments. As shown in figure 8, even if the concentration of the control sample was five times the glucose concentration, the glucose-containing sample had much higher absorbance than the control sample. In addition, the blue changes for glucose samples could be observed with the naked eye in the sucrose, fructose, lactose and maltose samples (as shown in the illustration of figure 8b). The experimental results show that the colorimetric reaction system had high selectivity for glucose.
Figure 8.
Responses of the developed Fe3O4@Pt NP-based analytical methods to blank samples (a) and various sugars, including glucose (b), fructose (c), lactose (d), maltose (e) and sucrose (f) (the inset shows the corresponding colorimetric photographs).
3.7. H2O2 and glucose assay based on the Fe3O4@Pt NPs
Based on the optimized conditions, the colorimetric detection system for H2O2 and glucose was constructed using the Fe3O4@Pt NPs as a catalyst. Electronic supplementary material, figure S3A shows the corresponding changes in absorbance at 652 nm when the H2O2 concentration was varied from 5–1000 µM. Electronic supplementary material, figure S3B shows that the linear range was 5–400 µM. The limits of detection (LOD) in this work were calculated as 3 σ/S, where σ is the standard deviation of replicate measurements of the blank sample signal and S is the sensitivity (slope of the regression equation). The LOD was 0.36 µM based on the hydrogen peroxide detection method. The detection limits of different nanoenzymes for colorimetric hydrogen peroxide detection are listed in electronic supplementary material, table S2. The limits for the detection of hydrogen peroxide by nanoenzymes were comparable to those in the literature and had been improved.
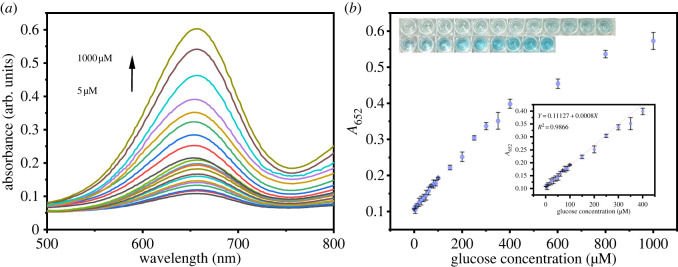
Figure 9a shows the changes in absorbance at 652 nm when the glucose concentration was varied from 5–1000 µM. Figure 9b shows that the linear range was 5–400 µM, and the detection limit was 1.27 µM. The detection limits of different nanoenzymes for colorimetric glucose detection are listed in electronic supplementary material, table S3. By comparison, the LOD of hydrogen peroxide by nanoenzymes were comparable to those in the literature and had been improved.
Figure 9.
(a) UV–vis spectra to show the change in glucose concentration and (b) dose–response curve for the glucose concentration and absorbance (the inset shows the corresponding homology calibration curve and colorimetric photographs).
3.8. Detection of blood glucose and urine glucose
To verify the practical application value of the system, glucose in diluted serum and urine was detected with Fe3O4@Pt NPs. In tables 1 and 2, the recoveries of the measured values based on the standard curve were 92.76–102.93% and 91.81–103.48%, respectively, which indicates that the detection system exhibited good detection of glucose in actual samples.
Table 1.
Detection of glucose in human blood samples. (n = 3)
| glucose added (μM) | glucose found (μM) | recovery (%) | RSD (%) |
|---|---|---|---|
| 0 | — | — | — |
| 20 | 18.98 | 94.90 | 2.25 |
| 50 | 47.00 | 94.00 | 1.65 |
| 80 | 74.21 | 92.76 | 0.83 |
| 100 | 99.99 | 99.99 | 0.77 |
| 200 | 190.4 | 95.24 | 1.42 |
| 400 | 411.7 | 102.93 | 1.95 |
Table 2.
Detection of glucose levels in human urine. (n = 3)
| glucose added (μM) | glucose found (μM) | recovery (%) | RSD (%) |
|---|---|---|---|
| 0 | — | — | — |
| 20 | 18.36 | 91.81 | 0.37 |
| 50 | 48.61 | 97.23 | 0.71 |
| 80 | 76.64 | 95.80 | 1.26 |
| 100 | 94.95 | 94.95 | 0.57 |
| 200 | 191.8 | 95.93 | 2.28 |
| 400 | 413.9 | 103.48 | 2.06 |
3.9. Paper-based detection of glucose
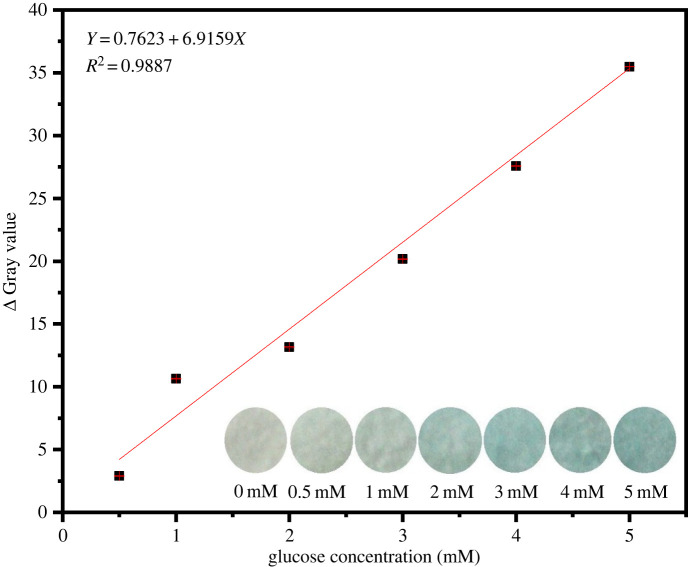
The use of test strips to detect glucose was also studied. The sensing efficiency was determined for a paper-based sensor strip. Low-cost and easy-to-use cellulose filter paper was employed in the study. As shown in the inset of figure 10, the colour of the dye strip ranged from colourless to blue, and the colour depth increased with increasing glucose concentration. Figure 10 illustrates the relationship between grayscale value and glucose concentration. It shows a good linear relationship, the linear range was 0.5–5 mM (R2 = 0.9887), which satisfies the requirements for normal detection of human serum glucose (3.9–6.4 mM), and the detection limit was 0.39 mM. Hence, the Fe3O4@Pt NPs and paper-based method developed in this work can be applied to detect glucose without requiring a measuring instrument.
Figure 10.
Greyscale value of the glucose concentration change (the inset shows the corresponding photographs).
To study the application of this paper-based platform in studies of real samples, we detected the peak values for glucose concentration in diluted serum and urine at different concentrations and compared them with those of a commercial blood glucose metre. As shown in tables 3 and 4, the recoveries of the measured values based on the standard curve for the detection of human blood glucose and human urine glucose were 97.14–99.62% and 97.04–104.93%, respectively. In addition, the results of this method were consistent with those of the blood glucose meter sold in the market. The results showed that the developed system had a good effect on the detection of glucose in actual samples.
Table 3.
Detection of glucose in human blood samples. (n = 3)
| glucose added (mM) | colour | glucose found (mM) | recovery (%) | RSD (%) | glucose metre |
|---|---|---|---|---|---|
| 0 |  |
— | — | — | — |
| 1 |  |
0.9882 | 98.82 | 4.86 | — |
| 3 |  |
2.9886 | 99.62 | 1.11 | 2.8 |
| 5 |  |
4.8569 | 97.14 | 1.99 | 4.9 |
Table 4.
Detection of glucose levels in human urine. (n = 3)
| glucose added (mM) | colour | glucose found (mM) | recovery (%) | RSD (%) | glucose metre |
|---|---|---|---|---|---|
| 0 |  |
— | — | — | — |
| 1 |  |
0.9730 | 97.30 | 4.55 | — |
| 3 |  |
3.148 | 104.93 | 2.88 | 2.8 |
| 5 |  |
4.852 | 97.04 | 4.26 | 4.8 |
4. Conclusion
In summary, a Pt nanoparticle composite catalyst grown in situ on Fe3O4 NPs was constructed to detect H2O2 and glucose. Due to a synergistic effect, the core (Fe3O4)–shell (Pt) magnetic nanoparticles (Fe3O4@Pt NPs) had higher catalytic activity than the Fe3O4 NPs. The material was applied to detect glucose in serum and urine samples. The linear ranges for H2O2 and glucose were 5–400 µM (R2 = 0.9968) and 5–400 µM (R2 = 0.9866), respectively, and the detection limits were 0.36 µM and 1.27 µM, respectively. The recoveries with serum and urine were 92.76 − 102.93% and 91.81 − 103.48%, respectively. Furthermore, a fabricated colorimetric method was successfully applied to analyze glucose concentrations using a paper device as a measuring platform without requiring a spectrometer. This method exhibited satisfactory recovery values for glucose detection in human serum samples and urine samples and satisfies the requirements for normal detection in real samples. This study demonstrates a good candidate for the health monitoring of glucose and expands the applications of nanoenzymes and paper-based colorimetric assays in point-of-care testing.
Ethics
Ethical approval to perform this study was granted by the Fujian Medical University Research Ethics Committee.
Data accessibility
The datasets supporting this article have been uploaded as part of the electronic supplementary material [49].
Authors' contributions
Y.H.: conceptualization, funding acquisition, methodology, validation, writing—review and editing; P.W.: conceptualization, formal analysis, investigation, validation, writing—original draft; X.C.: formal analysis, investigation; Y.L.: formal analysis, investigation; J.W.: formal analysis, investigation; G.C.: supervision, validation; K.A.: supervision, validation; W.W.: conceptualization, funding acquisition, methodology, supervision, visualization, writing—review and editing.
All authors gave final approval for publication and agreed to be held accountable for the work performed therein.
Conflict of interest declaration
We declare we have no competing interests.
Funding
This work was supported by the Natural Science Foundation of Fujian Province, China (Grant No. 2021J01727), the Project of Fujian Medical University (Grant No. 2021B015), Startup Fund for Scientific Research, Fujian Medical University (Grant No. 2018QH1010), Fujian Medical University's Research Foundation for Talented Scholars (Grant No. XRCZX2019004) and Undergraduate Innovation and Entrepreneurship Training Program, Fujian Medical University (Grant No. C21101).
References
- 1.Boles A, Kandimalla R, Reddy PH. 2017. Dynamics of diabetes and obesity: epidemiological perspective. Biochim. Biophys. Acta Mol. Basis Dis. 1863, 1026-1036. ( 10.1016/j.bbadis.2017.01.016) [DOI] [PMC free article] [PubMed] [Google Scholar]
- 2.Yun J, et al. 2009. Glucose deprivation contributes to the development of KRAS pathway mutations in tumor cells. Science 325, 1555-1559. ( 10.1126/science.1174229) [DOI] [PMC free article] [PubMed] [Google Scholar]
- 3.Maric T, et al. 2019. Bioluminescent-based imaging and quantification of glucose uptake in vivo. Nat. Methods. 16, 526-532. ( 10.1038/s41592-019-0421-z) [DOI] [PMC free article] [PubMed] [Google Scholar]
- 4.Oliver NS, Toumazou C, Cass AE, Johnston DG. 2009. Glucose sensors: a review of current and emerging technology. Diabet Med. 26, 197-210. ( 10.1111/j.1464-5491.2008.02642.x) [DOI] [PubMed] [Google Scholar]
- 5.Hassan MH, Vyas C, Grieve B, Bartolo P. 2021. Recent Advances in enzymatic and non-enzymatic electrochemical glucose sensing. Sensors 21, 4672. ( 10.3390/s21144672) [DOI] [PMC free article] [PubMed] [Google Scholar]
- 6.Zhou Y, Hu Q, Yu F, Ran GY, Wang HY, Shepherd ND, D'Alessandro DM, Kurmoo M, Zuo JL. 2020. A metal-organic framework based on a nickel bis(dithiolene) connector: synthesis, crystal structure, and application as an electrochemical glucose sensor. J. Am. Chem. Soc. 142, 20 313-20 317. ( 10.1021/jacs.0c09009) [DOI] [PubMed] [Google Scholar]
- 7.Xu J, Sun Y, Zhang J. 2020. Solvothermal synthesis of Fe3O4 nanospheres for high-performance electrochemical non-enzymatic glucose sensor. Sci. Rep. 10, 16026. ( 10.1038/s41598-020-73090-4) [DOI] [PMC free article] [PubMed] [Google Scholar]
- 8.Li Y, Cai R, Lü R, Gao L, Qin S. 2018. Template synthesis of the Cu2O nanoparticle-doped hollow carbon nanofibres and their application as non-enzymatic glucose biosensors. R. Soc. Open Sci. 5, 181474. ( 10.1098/rsos.181474) [DOI] [PMC free article] [PubMed] [Google Scholar]
- 9.Zhao Y, Yang J, Shan G, Liu Z, Cui A, Wang A, Chen Y, Liu Y. 2020. Photothermal-enhanced tandem enzyme-like activity of Ag2−xCuxS nanoparticles for one-step colorimetric glucose detection in unprocessed human urine. Sens. Actuators, B. 305, 127420. ( 10.1016/j.snb.2019.127420) [DOI] [Google Scholar]
- 10.Zhang J, Dai X, Song Z-L, Han R, Ma L, Fan G-C, Luo X. 2020. One-pot enzyme- and indicator-free colorimetric sensing of glucose based on MnO2 nano-oxidizer. Sens. Actuators, B. 304, 127304. ( 10.1016/j.snb.2019.127304) [DOI] [Google Scholar]
- 11.Kim MS, Kim DH, Lee J, Ahn HT, Kim MI, Lee J. 2020. Self color-changing ordered mesoporous ceria for reagent-free colorimetric biosensing. Nanoscale 12, 1419-1424. ( 10.1039/c9nr09182c) [DOI] [PubMed] [Google Scholar]
- 12.Phiri MM, Mulder DW, Vorster BC. 2019. Seedless gold nanostars with seed-like advantages for biosensing applications. R. Soc. Open Sci. 6, 181971. ( 10.1098/rsos.181971) [DOI] [PMC free article] [PubMed] [Google Scholar]
- 13.Chen P, Zhong H, Wang X, Shao C, Zhi S, Li X-R, Wei C. 2019. A label-free colorimetric strategy for facile and low-cost sensing of ascorbic acid using MnO2 nanosheets. Anal. Methods 11, 1469-1474. ( 10.1039/c9ay00091g) [DOI] [Google Scholar]
- 14.Cai Q, Meng H, Liu Y, Li Z. 2019. Fluorometric determination of glucose based on a redox reaction between glucose and aminopropyltriethoxysilane and in-situ formation of blue-green emitting silicon nanodots. Mikrochim. Acta. 186, 78. ( 10.1007/s00604-018-3189-4) [DOI] [PubMed] [Google Scholar]
- 15.Ramos-Soriano J, Benitez-Benitez SJ, Davis AP, Galan MC. 2021. A vibration-induced-emission-based fluorescent chemosensor for the selective and visual recognition of glucose. Angew. Chem. Int. Ed. Engl. 60, 16 880-16 884. ( 10.1002/anie.202103545) [DOI] [PMC free article] [PubMed] [Google Scholar]
- 16.Mello GPC, Simões EFC, Crista DMA, Leitão JMM, Pinto da Silva L, Esteves da Silva JCG. 2019. Glucose sensing by fluorescent nanomaterials. Crit. Rev. Anal. Chem. 49, 542-552. ( 10.1080/10408347.2019.1565984) [DOI] [PubMed] [Google Scholar]
- 17.Dang P, Liu X, Ju H, Wu J. 2020. Intensive and persistent chemiluminescence system based on nano-/bioenzymes with local tandem catalysis and surface diffusion. Anal. Chem. 92, 5517-5523. ( 10.1021/acs.analchem.0c00337) [DOI] [PubMed] [Google Scholar]
- 18.Zhao Y, Xu X, Ma Y, Tan H, Li Y. 2020. A novel peroxidase/oxidase mimetic Fe-porphyrin covalent organic framework enhanced the luminol chemiluminescence reaction and its application in glucose sensing. Luminescence 35, 1366-1372. ( 10.1002/bio.3899) [DOI] [PubMed] [Google Scholar]
- 19.Hu S, Jiang Y, Wu Y, Guo X, Ying Y, Wen Y, Yang H. 2020. Enzyme-free tandem reaction strategy for surface-enhanced Raman scattering detection of glucose by using the composite of Au nanoparticles and porphyrin-based metal-organic framework. ACS Appl. Mater. Interfaces 12, 55 324-55 330. ( 10.1021/acsami.0c12988) [DOI] [PubMed] [Google Scholar]
- 20.Xu M, Zhang L, Zhao F. 2020. One-pot aqueous synthesis of icosahedral Au as bifunctional candidates for enhanced glucose electrooxidation and surface-enhanced Raman scattering. ACS Appl. Mater. Interfaces. 12, 12 186-12 194. ( 10.1021/acsami.9b15715) [DOI] [PubMed] [Google Scholar]
- 21.Ju J, et al. 2020. Surface enhanced Raman spectroscopy based biosensor with a microneedle array for minimally invasive in vivo glucose measurements. ACS Sens. 5, 1777-1785. ( 10.1021/acssensors.0c00444) [DOI] [PubMed] [Google Scholar]
- 22.Sun D, Qi G, Xu S, Xu W. 2016. Construction of highly sensitive surface-enhanced Raman scattering (SERS) nanosensor aimed for the testing of glucose in urine. RSC Adv. 6, 53 800-53 803. [Google Scholar]
- 23.Steiner MS, Duerkop A, Wolfbeis OS. 2011. Optical methods for sensing glucose. Chem. Soc. Rev. 40, 4805-4839. ( 10.1039/c1cs15063d) [DOI] [PubMed] [Google Scholar]
- 24.Xiong Y, Zhang Y, Rong P, Yang J, Wang W, Liu D. 2015. A high-throughput colorimetric assay for glucose detection based on glucose oxidase-catalyzed enlargement of gold nanoparticles. Nanoscale 7, 15 584-15 588. ( 10.1039/c5nr03758a) [DOI] [PubMed] [Google Scholar]
- 25.Adeniyi O, Sicwetsha S, Mashazi P. 2020. Nanomagnet-silica nanoparticles decorated with Au@Pd for enhanced peroxidase-like activity and colorimetric glucose sensing. ACS Appl. Mater. Interfaces 12, 1973-1987. ( 10.1021/acsami.9b15123) [DOI] [PubMed] [Google Scholar]
- 26.Liang M, Yan X. 2019. Nanozymes: from new concepts, mechanisms, and standards to applications. Acc. Chem. Res. 52, 2190-2200. ( 10.1021/acs.accounts.9b00140) [DOI] [PubMed] [Google Scholar]
- 27.Jin X, Zhong Y, Chen L, Xu L, Wu Y, Fu F. 2018. A palladium-doped graphitic carbon nitride nanosheet with high peroxidase-like activity: preparation, characterization, and application in glucose detection. Part. Part. Syst. Charact. 35, 1700359. ( 10.1002/ppsc.201700359) [DOI] [Google Scholar]
- 28.Yang W, Weng C, Li X, Xu W, Fei J, Hong J, Zhang J, Zhu W, Zhou X. 2022. An ‘on-off’ ratio photoluminescence sensor based on catalytically induced PET effect by Fe3O4 NPs for the determination of coumarin. Food Chem. 368, 130838. ( 10.1016/j.foodchem.2021.130838) [DOI] [PubMed] [Google Scholar]
- 29.Li Y, Chang Y, Yuan R, Chai Y. 2018. Highly efficient target recycling-based netlike Y-DNA for regulation of electrocatalysis toward methylene blue for sensitive DNA detection. ACS Appl. Mater. Interfaces 10, 25 213-25 218. ( 10.1021/acsami.8b08545) [DOI] [PubMed] [Google Scholar]
- 30.Chen P, Zhong H, Li X-R, Li M, Zhou S. 2021. Palygorskite@Co3O4 nanocomposites as efficient peroxidase mimics for colorimetric detection of H2O2 and ascorbic acid. Appl. Clay Sci. 209, 106109. ( 10.1016/j.clay.2021.106109) [DOI] [Google Scholar]
- 31.Gao L, et al. 2007. Intrinsic peroxidase-like activity of ferromagnetic nanoparticles. Nat. Nanotechnol. 2, 577-583. ( 10.1038/nnano.2007.260) [DOI] [PubMed] [Google Scholar]
- 32.Wei H, Wang E. 2008. Fe3O4 magnetic nanoparticles as peroxidase mimetics and their applications in H2O2 and glucose detection. Anal. Chem. 80, 2250-2254. ( 10.1021/ac702203f) [DOI] [PubMed] [Google Scholar]
- 33.Huang Y, Ren J, Qu X. 2019. Nanozymes: classification, catalytic mechanisms, activity regulation, and applications. Chem. Rev. 119, 4357-4412. ( 10.1021/acs.chemrev.8b00672) [DOI] [PubMed] [Google Scholar]
- 34.He SB, Chen RT, Wu YY, Wu GW, Peng HP, Liu AL, Deng HH, Xia XH, Chen W. 2019. Improved enzymatic assay for hydrogen peroxide and glucose by exploiting the enzyme-mimicking properties of BSA-coated platinum nanoparticles. Mikrochim. Acta. 186, 778. ( 10.1007/s00604-019-3939-y) [DOI] [PubMed] [Google Scholar]
- 35.Bao YW, Hua XW, Ran HH, Zeng J, Wu FG. 2019. Metal-doped carbon nanoparticles with intrinsic peroxidase-like activity for colorimetric detection of H2O2 and glucose. J. Biomed. Mater. Res. B Appl. Biomater. 7, 296-304. ( 10.1039/c8tb02404a) [DOI] [PubMed] [Google Scholar]
- 36.He SB, Yang L, Lin XL, Peng HP, Lin Z, Deng HH, Chen W, Hong GL. 2020. Sodium alginate modified platinum nanozymes with highly efficient and robust oxidase-like activity for antioxidant capacity and analysis of proanthocyanidins. Front. Chem. 8, 654. ( 10.3389/fchem.2020.00654) [DOI] [PMC free article] [PubMed] [Google Scholar]
- 37.Han Q, Wang X, Liu X, Xiao W, Cai S, Wang C, Yang R. 2019. Controllable fabrication of magnetic core-shell nanocomposites with high peroxide mimetic properties for bacterial detection and antibacterial applications. J. Biomed. Mater. Res. B Appl. Biomater. 7, 1124-1132. ( 10.1039/c8tb02834f) [DOI] [PubMed] [Google Scholar]
- 38.Deng H, Liu H, Kang W, Lei C, Nie Z, Huang Y, Yao S. 2020. Biomineralization synthesis of a near-infrared fluorescent nanoprobe for direct glucose sensing in whole blood. Nanoscale 12, 864-870. ( 10.1039/c9nr06691h) [DOI] [PubMed] [Google Scholar]
- 39.Yang Q, Li N, Li Q, Chen S, Wang HL, Yang H. 2019. Amperometric sarcosine biosensor based on hollow magnetic Pt-Fe3O4@C nanospheres. Anal. Chim. Acta. 1078, 161-167. ( 10.1016/j.aca.2019.06.031) [DOI] [PubMed] [Google Scholar]
- 40.Lai X, Zhang G, Zeng L, Xiao X, Peng J, Guo P, Zhang W, Lai W. 2021. Synthesis of PDA-mediated magnetic bimetallic nanozyme and its application in immunochromatographic assay. ACS Appl. Mater. Interfaces. 13, 1413-1423. ( 10.1021/acsami.0c17957) [DOI] [PubMed] [Google Scholar]
- 41.Li S, Zhao X, Yu X, Wan Y, Yin M, Zhang W, Cao B, Wang H. 2019. Fe3O4 nanozymes with aptamer-tuned catalysis for selective colorimetric analysis of ATP in blood. Anal. Chem. 91, 14 737-14 742. ( 10.1021/acs.analchem.9b04116) [DOI] [PubMed] [Google Scholar]
- 42.Li G, Tang Z. 2014. Noble metal nanoparticle@metal oxide core/yolk-shell nanostructures as catalysts: recent progress and perspective. Nanoscale 6, 3995-4011. ( 10.1039/c3nr06787d) [DOI] [PubMed] [Google Scholar]
- 43.Cui W, Xue D, Tan N, Zheng B, Jia M, Zhang W. 2018. Pt supported on octahedral Fe3O4 microcrystals as a catalyst for removal of formaldehyde under ambient conditions. Chin. J. Catal. 39, 1534-1542. ( 10.1016/s1872-2067(18)63082-7) [DOI] [Google Scholar]
- 44.Zubir NA, Yacou C, Motuzas J, Zhang X, Diniz da Costa JC. 2014. Structural and functional investigation of graphene oxide-Fe3O4 nanocomposites for the heterogeneous Fenton-like reaction. Sci. Rep. 4, 4594. ( 10.1038/srep04594) [DOI] [PMC free article] [PubMed] [Google Scholar]
- 45.Bai L, Jiang W, Sang M, Liu M, Xuan S, Wang S, Leung KC-F, Gong X. 2019. Magnetic microspheres with polydopamine encapsulated ultra-small noble metal nanocrystals as mimetic enzymes for the colorimetric detection of H2O2 and glucose. J. Biomed. Mater. Res. B Appl. Biomater. 7, 4568-4580. ( 10.1039/c9tb00755e) [DOI] [Google Scholar]
- 46.Zheng J, Dong Y, Wang W, Ma Y, Hu J, Chen X, Chen X. 2013. In situ loading of gold nanoparticles on Fe3O4@SiO2 magnetic nanocomposites and their high catalytic activity. Nanoscale 5, 4894-4901. ( 10.1039/c3nr01075a) [DOI] [PubMed] [Google Scholar]
- 47.Gao M, An P, Rao H, Niu Z, Xue X, Luo M, Liu X, Xue Z, Lu X. 2020. Molecule-gated surface chemistry of Pt nanoparticles for constructing activity-controllable nanozymes and a three-in-one sensor. Analyst 145, 1279-1287. ( 10.1039/c9an01956a) [DOI] [PubMed] [Google Scholar]
- 48.Ma M, Xie J, Zhang Y, Chen Z, Gu N. 2013. Fe3O4@Pt nanoparticles with enhanced peroxidase-like catalytic activity. Mater. Lett. 105, 36-39. ( 10.1016/j.matlet.2013.04.020) [DOI] [Google Scholar]
- 49.He Y, Wang P, Chen X, Li Y, Wei J, Cai G, Aoyagi K, Wang W. 2022. Data from: Facile preparation of Fe3O4@Pt nanoparticles as peroxidase mimics for sensitive glucose detection by a paper-based colorimetric assay. Figshare. ( 10.6084/m9.figshare.c.6197431) [DOI] [PMC free article] [PubMed]
Associated Data
This section collects any data citations, data availability statements, or supplementary materials included in this article.
Data Citations
- He Y, Wang P, Chen X, Li Y, Wei J, Cai G, Aoyagi K, Wang W. 2022. Data from: Facile preparation of Fe3O4@Pt nanoparticles as peroxidase mimics for sensitive glucose detection by a paper-based colorimetric assay. Figshare. ( 10.6084/m9.figshare.c.6197431) [DOI] [PMC free article] [PubMed]
Data Availability Statement
The datasets supporting this article have been uploaded as part of the electronic supplementary material [49].


