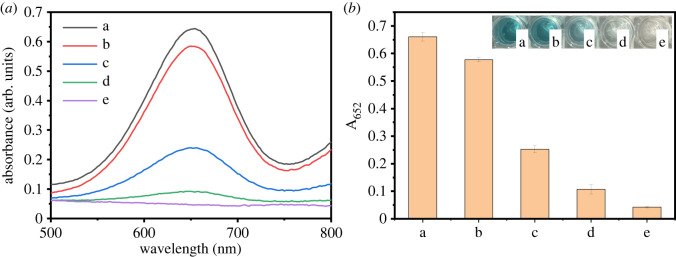
Figure 5.
UV–vis absorption spectra (the inset shows the corresponding colorimetric photographs) of sodium citrate buffer (pH 4.0) containing 1 mM H2O2 and 1.6 mM TMB in the presence of Fe3O4@Pt NPs (20 µg ml−1) (a), Fe3O4 NPs (20 µg ml−1) (b) and Pt NPs (20 μg ml−1) (c). The control group constituted the same reaction system but without TMB (d) and H2O2 (e).

