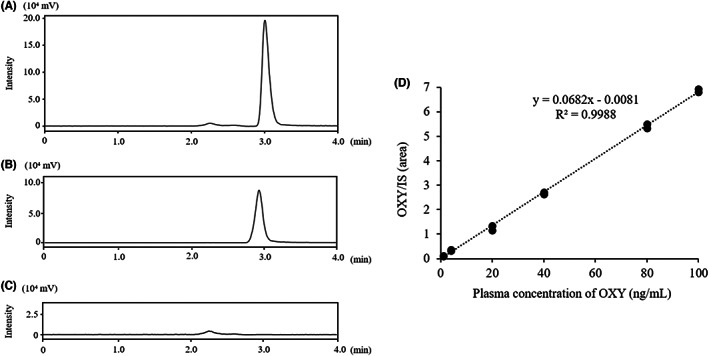
FIGURE 1.

Typical chromatograms of OXY and IS in plasma. (A) 20 ng/ml of OXY; (B) 50 ng/ml of PAV (IS); (C) Blank plasma (OXY‐ and IS‐free sample); (D) Standard curve (n = 2)

Typical chromatograms of OXY and IS in plasma. (A) 20 ng/ml of OXY; (B) 50 ng/ml of PAV (IS); (C) Blank plasma (OXY‐ and IS‐free sample); (D) Standard curve (n = 2)