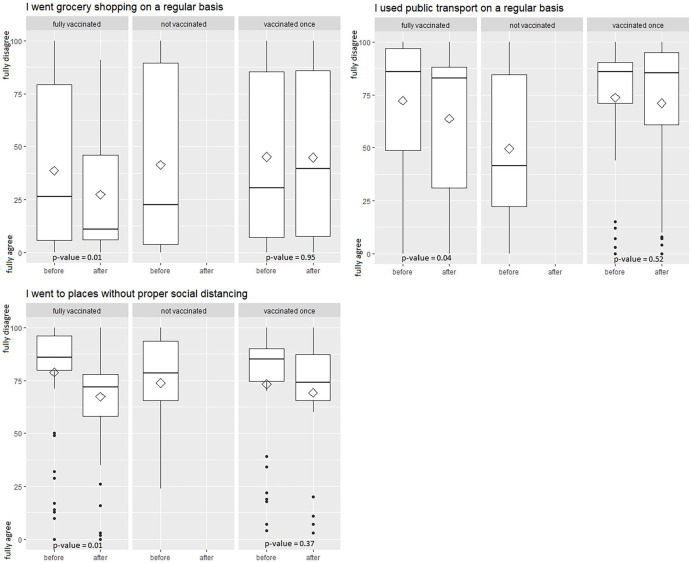
Figure 3.
Change in movements after vaccination stratified by vaccination status. Boxplots of movements before and after COVID-19 vaccinations, stratified by COVID-19 vaccination status. Behavior was measured on a VAS from 0 (full agreement) to 100 (full disagreement) for the time before and the time after vaccination. P values are from paired t test. VAS indicates visual analog scale.

