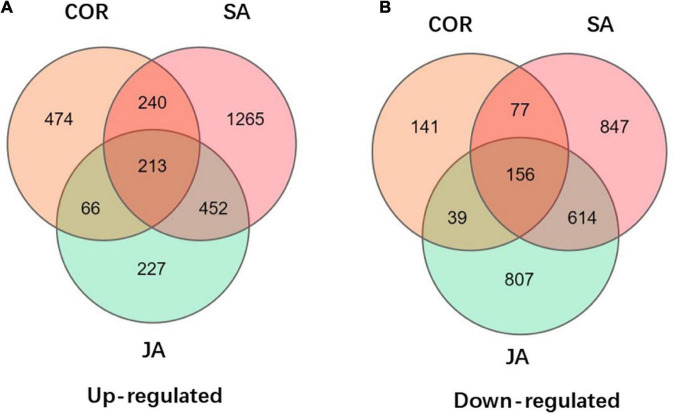
FIGURE 5.
Venn diagrams displays the distribution of up-regulated and down-regulated differentially expressed genes (DEGs) upon coronatine (COR), salicylic acid (SA), and jasmonate acid (JA) treatments followed by tomato yellow leaf curl virus (TYLCV) invasion. (A) Up-regulated of DEGs by JA, SA, and COR treatments followed by TYLCV invasion. (B) Down-regulated of DEGs by JA, SA, and COR treatments followed by TYLCV invasion.

