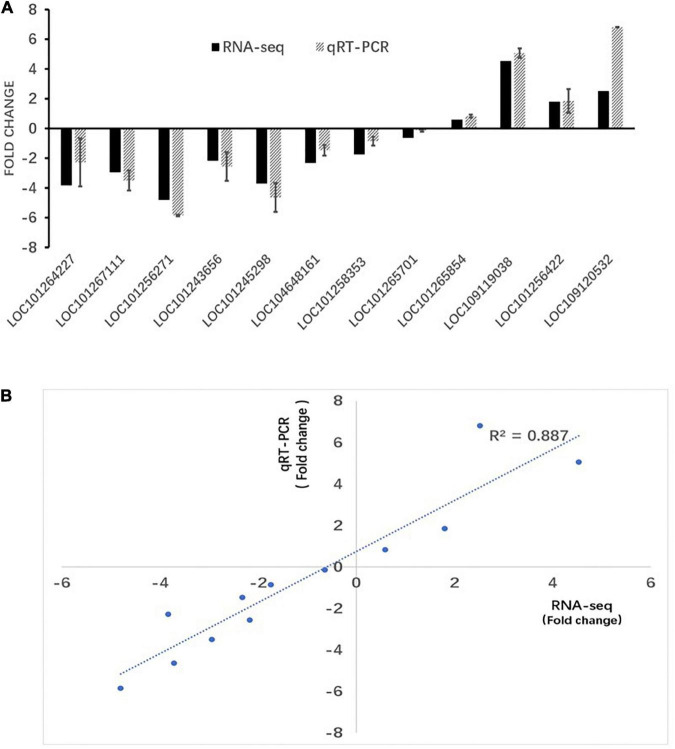
FIGURE 7.
RT-PCR verification of RNA-seq results. (A) RT-qPCR and RNA-seq comparison between 12 randomly selected differentially expressed genes (DEGs). The RT-qPCR values represent mean ± SEM from three biological replicates. (B) Regression analysis of gene expression ratios compared by RT-qPCR and RNA-seq analysis.

