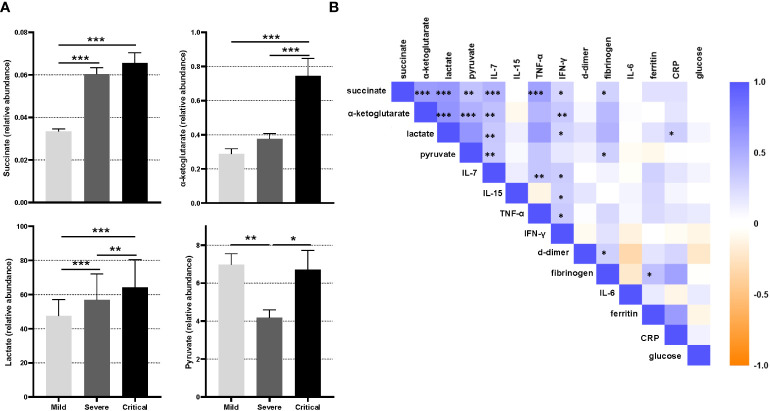
Figure 2.
Semi-targeted metabolomics study of patients in cohort 1. (A) Relative abundance of succinate, α-ketoglutarate, lactate and pyruvate acid in patients grouped by disease severity (mild, severe and critical). Statistical significance between different groups was estimated using the Kruskal-Wallis test. Bars represent median values ± SEM. (B) Correlation matrix between relevant parameters previously related to COVID-19 severity and metabolites measured in patients of cohort 1. The color of the squares corresponds to the absolute value of the Spearman correlation coefficient, with orange or blue color indicating negative or positive correlation, respectively. A blank square indicates a lack of correlation between variables. The results were considered significant at *P<0.05; **P<0.01; ***P<0.001.

