Figure 2.

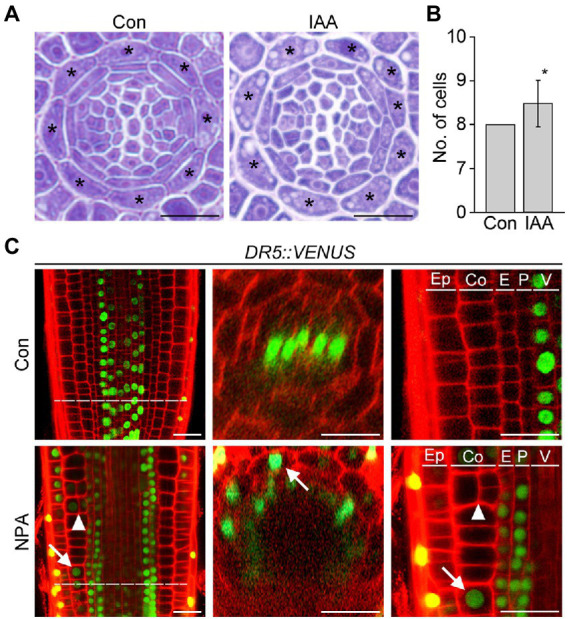
Auxin affects cortical cell division. Transverse sections (A) and quantification of the number of cortical cells (B) in the roots of wild-type plants grown under control conditions (Con) and plants treated with auxin (IAA, 500 nM) for 7 days (n > 15). Asterisks in the images indicate cortical cells. Error bar represents SD, and the asterisk in the graph indicates a statistically significant difference between the corresponding samples and the control (Con; p < 0.01, two-tailed t-test). (C) Fluorescence images of DR5::VENUS roots grown under control (Con, top) and 3 μM NPA-treated conditions (NPA, bottom) for 7 days (left, longitudinal sections; middle, cross-sections; right, high-magnification images of longitudinal sections). Green and red fluorescence correspond to VENUS and propidium iodide (PI) signals, respectively. Dotted lines indicate the position where cross-sectioning was performed. White arrows and triangles indicate the auxin response in cortical cells and cortical cell division, respectively. Ep, epidermis; Co, cortex; E, endodermis; P, pericycle; V, vasculature. Scale bars = 20 μm.
