Figure 4.

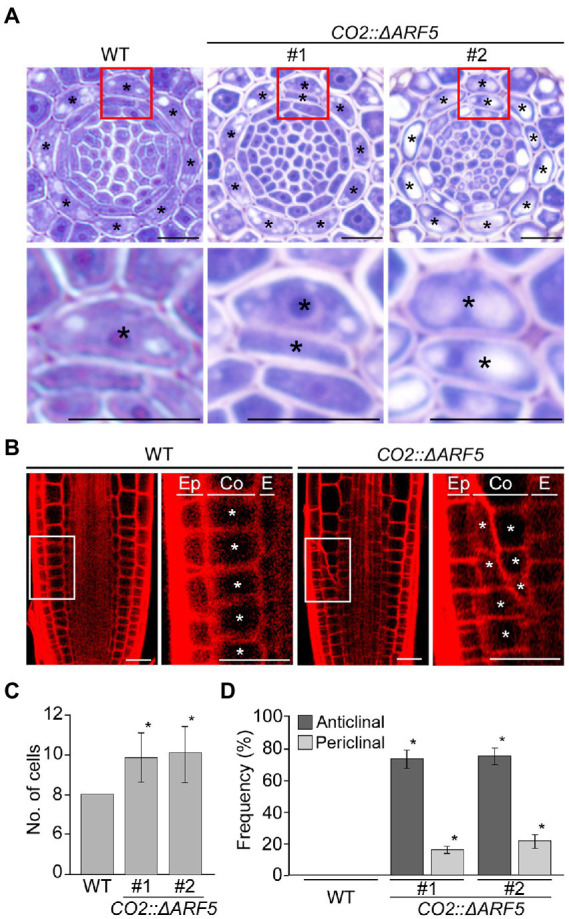
Division of cortical cells in CO2::ΔARF5 plants. (A) Transverse sections of the root meristem regions of wild-type and CO2::ΔARF5 plants grown in 1/2 MS solid medium for 7 days (top), and high-magnification images of the regions in boxes showing the periclinal division of cortical cells (bottom). #1 and 2 indicate two independent lines of CO2::ΔARF5 transgenic plants. (B) Fluorescence images of propidium iodide (PI)-stained wild-type and CO2::ΔARF5 plants (#1), and high-magnification images of the sections shown in white boxes. Ep, epidermis; Co, cortex; E, endodermis. Asterisks in (A) and (B) indicate cortical cells. Scale bars = 20 μm. (C,D) Quantification of cortical cells (C), and the frequency of anticlinal and periclinal divisions of cortical cells (D) in wild-type and CO2::ΔARF5 plants (n > 15). Error bars represent SD, and asterisks in the graphs indicate statistically significant differences between the corresponding samples and wild-type controls (p < 0.01, two-tailed t-test).
