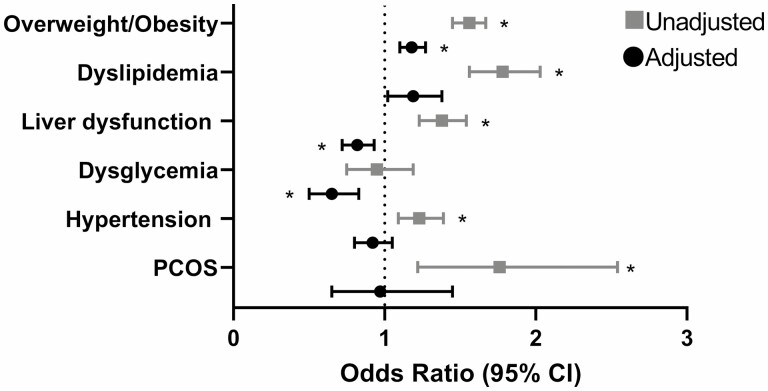
Figure 1.
Odds of cardiometabolic-related diagnoses among TGDY vs controls. The forest plots show the odds ratios and 95% CIs of cardiometabolic-related diagnoses among TGDY compared to controls. Higher odds ratios (> 1) indicate that TGDY are more likely to have the listed diagnosis. Lower odds ratios (< 1) indicate that TGDY are less likely to have the listed diagnosis. Unadjusted analyses are shown in gray squares; adjusted analyses (for overweight/obesity, depression, and antipsychotic medication use) are shown in black circles. Overweight/obesity and PCOS not adjusted for overweight/obesity. *P < .01. PCOS, polycystic ovary syndrome; TGDY, transgender and gender-diverse youth.

