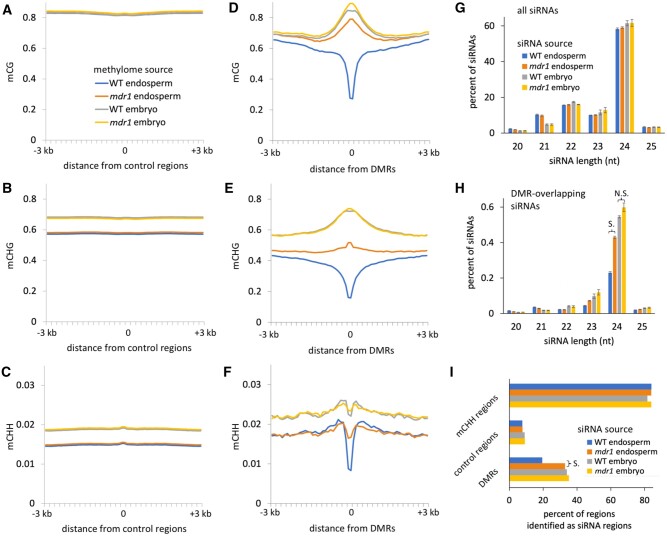
Figure 4.
A–C, mCG, mCHG, and mCHH profiles centered on control regions associated with wild-type vs. mdr1 endosperm DMRs. Methylation values are averages of 100-bp intervals within and up to 3 kb on either side of each 200-bp region. D–F, Same as A–C, except methylation centered on wild-type vs. mdr1 DMRs instead of control regions. G, Length distributions of all siRNAs. Error bars are standard errors of the means for biological replicates. H, As in G, except only siRNAs that overlapped at least 90% of their length with wild-type vs. mdr1 endosperm DMRs. “S.” indicates significant difference: P < 0.00001, two-tailed Student t test. “N.S.” indicated not significant: P = 0.06. I, Regions categorized by whether they produce siRNAs. An “siRNA region” is any that had at least 50 bp spanned by siRNAs of the indicated source tissues. All libraries were subsampled to 20 million siRNA reads. DMRs and control regions are from the wild-type vs. mdr1 endosperm comparison. mCHH regions are 200 bp regions with an average mCHH value of at least 0.2 in wild-type endosperm. “S.” indicates significant difference (P < 0.0001 two-tailed chi-square with Yates correction).

