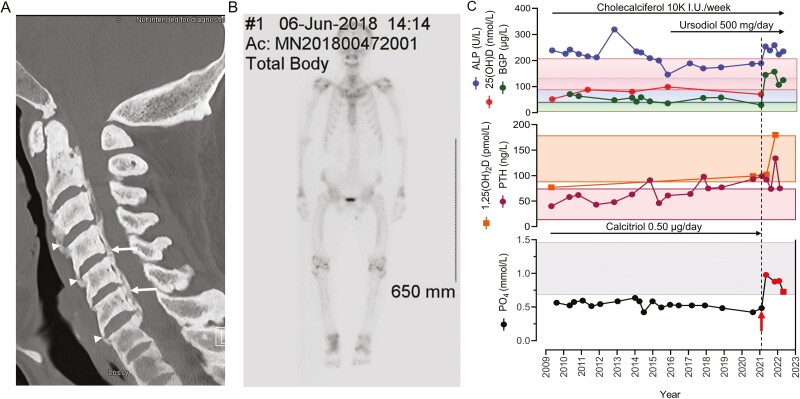
Figure 1.
A, Computed tomography scan imaging of the cervical spine at presentation, showing fusion of the vertebral bodies by syndesmophytes (arrowheads) and ossification of the posterior longitudinal ligament (arrows) leading to central canal stenosis. B, Whole-body Tc-99m-MDP bone scan demonstrating bone tracer uptake at the ankles, knees, hips, wrists, and shoulders, consistent with arthropathy. C, Longitudinal view of serum levels for alkaline phosphatase (ALP) activity, bone Gla-protein (BGP), 25-hydroxyvitamin D (25[OH]D) and 1,25-dihydroxyvitamin D (1,25[OH]2D), parathyroid hormone (PTH), and phosphate (PO4) before and following initiation of burosumab treatment (red arrow)/dashed line. Red circles indicate blood samples drawn 2 weeks following burosumab administration; red square indicates blood sample drawn just prior to the next burosumab dose. Normal ranges are indicated by the correspondingly colored rectangles. The treatment periods with ursodiol, cholecalciferol, and calcitriol are illustrated by black arrows.

