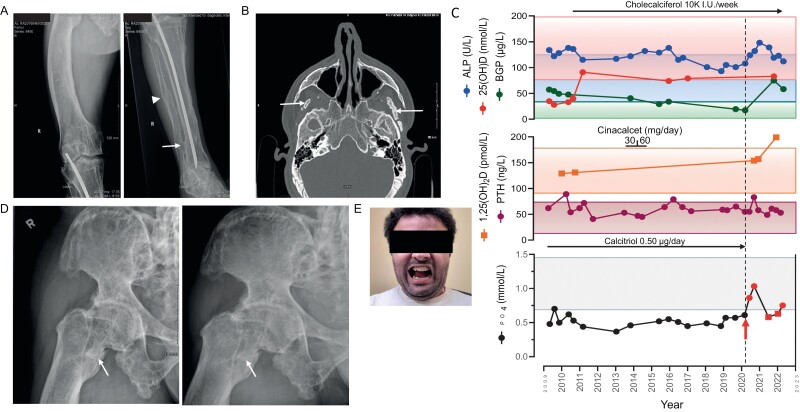
Figure 2.
A, Radiograph demonstrating the marked bowing of the right femur (left panel). Intramedullary rod in the tibia. Sequela of a previous fracture that has healed (arrowhead), with distal tibia-fibula ankyloses at the level of the distal interosseous membrane (arrow) (right panel). B, Computed tomography scan imaging of the facial bones shows the ossification within the inferior aspect of the temporalis muscles bilaterally (arrows). C, Longitudinal view of serum levels for alkaline phosphatase (ALP) activity, bone Gla-protein (BGP), 25-hydroxyvitamin D (25[OH]D) and 1,25-dihydroxyvitamin D (1,25[OH]2D), parathyroid hormone (PTH), and phosphate (PO4) before and following initiation of burosumab treatment (red arrow)/dashed line. Red circles indicate blood samples drawn 2 weeks following burosumab administration; red squares indicate blood samples drawn just prior to the next burosumab dose. Normal ranges are indicated by the correspondingly colored rectangles. The treatment periods with cinacalcet, cholecalciferol, and calcitriol are shown. D, Imaging of the right femur demonstrates a horizontal line with sclerotic edges at the level of the lesser trochanter, indicative of a pseudofracture (arrow, left panel). The same femur, 5 months into treatment with burosumab, with only a very subtle fracture line still visualized, consistent with ongoing healing (arrow, right panel). E, Following the second surgery, illustrating the maximal mouth opening achieved (2 fingerbreadths as compared to less than 1 fingerbreadth before surgery).

