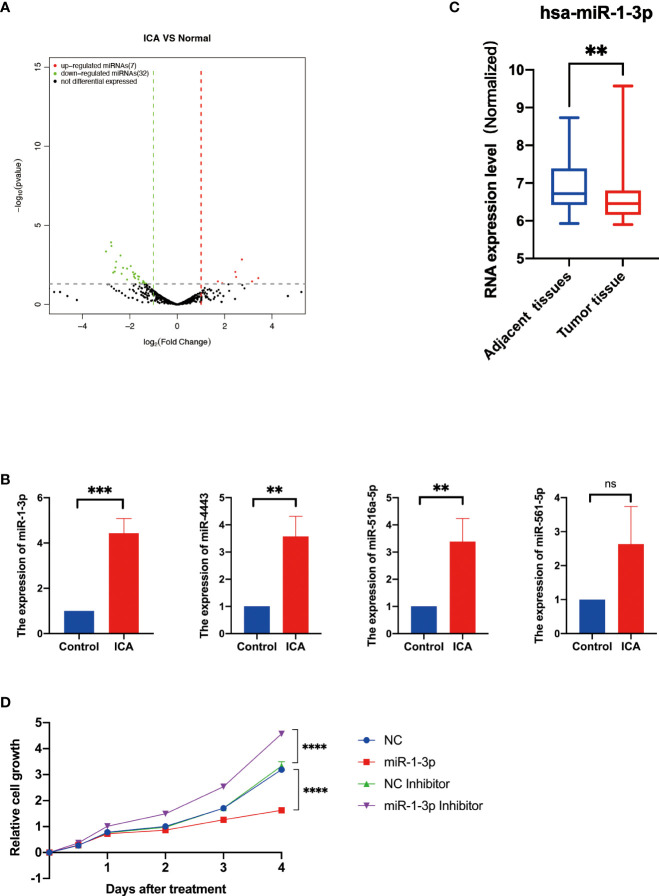
Figure 2.
Icariin upregulates the expression of miR-1-3p in SKOV-3 cells. (A) The volcano plot of miRNAs with differential expression. The DESeq2 program was used to evaluate changes in gene expression using a t test. Green (downregulated) and red (upregulated) dots indicate the 39 significant differentially expressed miRNAs. (B) RT–qPCR analysis of miR-516-5p, miR-4443, miR-516a-5p, and miR-1-3p expression in the SKOV-3 cells after icariin treatment. (n = 3 per group). (C) Expression analysis of miR-1-3p in adjacent normal tissues and ovarian cancer tissues from Gene Expression Omnibus Database (GSE31801, n=121), **p <0.01. (D) Growth curves of SKOV-3 cells transfected with indicated miRNAs. Data were shown with mean ± SD (n = 3), ns P > 0.05, **p < 0.01, ***p < 0.001, ****p < 0.0001.

