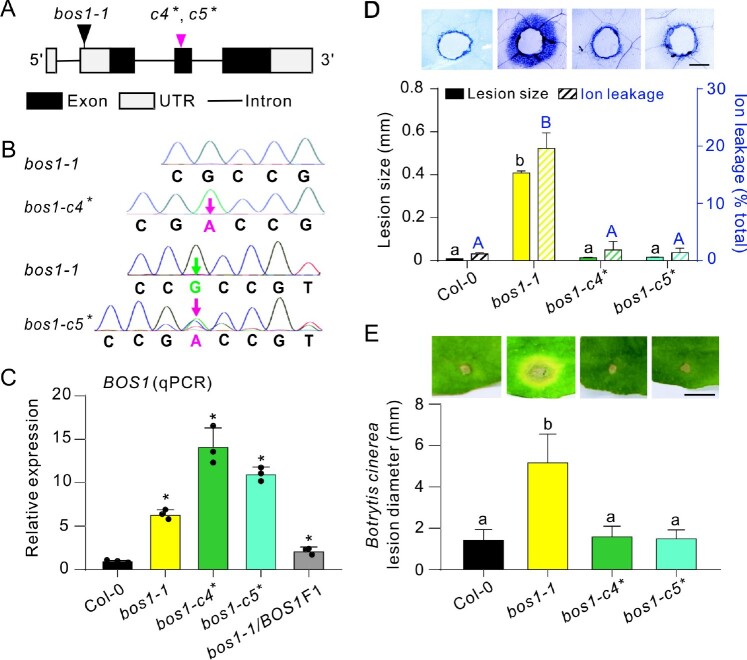
Figure 4.
Phenotypes of bos1-1 were suppressed by introduction of exon-disrupting alleles in BOS1. A, Schematic diagram of the new intragenic double mutants bos1-c4* and bos1-c5* created using the CRISPR/Cas9 system in the bos1-1 background. These alleles had both the T-DNA insertions of bos1-1 and the frame shift-inducing SNPs in the second exon of BOS1. The black triangle indicates the T-DNA insertion site in bos1-1. The magenta triangle indicates the start of the frame shifts in bos1-c4* and bos1-c5* (c4*, c5*). See Supplemental Figure S1 for the predicted amino acid sequence of the truncated proteins encoded by bos1-c4* and bos1-c5*. B, Single base insertions (magenta characters) and deletions (green characters) were detected with Sanger sequencing. The adenine insertion in bos1-c4* was homozygous, while in bos1-c5* there were two changes, the insertion of an adenine and the deletion of a guanine. C, Relative expression of BOS1 in the indicated genotypes. Fully expanded leaves of 24-day-old plants were used for qPCR. Data are shown as mean ± sd (n = 3 technical replicates, two biological replicates showed similar results). Asterisks above the bars indicate means that are significantly different from wild-type Col-0 (P < 0.05; t test, two-sided, Supplemental File S1). D, Wounding-induced cell-death spread visualized with trypan blue staining. Following puncture of leaves with a toothpick, the distance from the wound edge to the outer border of the area of cell death was measured (black bars). Representative photos illustrate the dead tissues around the toothpick-puncture wounds. Bars represent mean ± se (three biological repeats; each analyzing wounds from five individual leaves; n = 12 in total). Ion leakage (blue striped bars) from wounded leaves was measured at 5 dpw and is expressed as percentage of total ions, determined after disrupting all membranes by freezing. Bars represent mean ± se (three biological repeats; three leaves were combined as one sample; n = 12 samples in total). Letters above the bars indicated significance groups (P < 0.05; one-way ANOVA, Supplemental File S1), lower case letters, wound-induced lesion size; upper case letters, ion leakage. Bar = 0.5 mm. E, Botrytis-induced lesion size in the indicated genotype. Bars represent mean ± se (three independent biological replicates; each analyzing leaves from five individual plants; n ≥ 53 in total). Letters above the bars indicate significance groups (P < 0.05, one-way ANOVA, Supplemental File S1). Bar = 0.5 cm.

