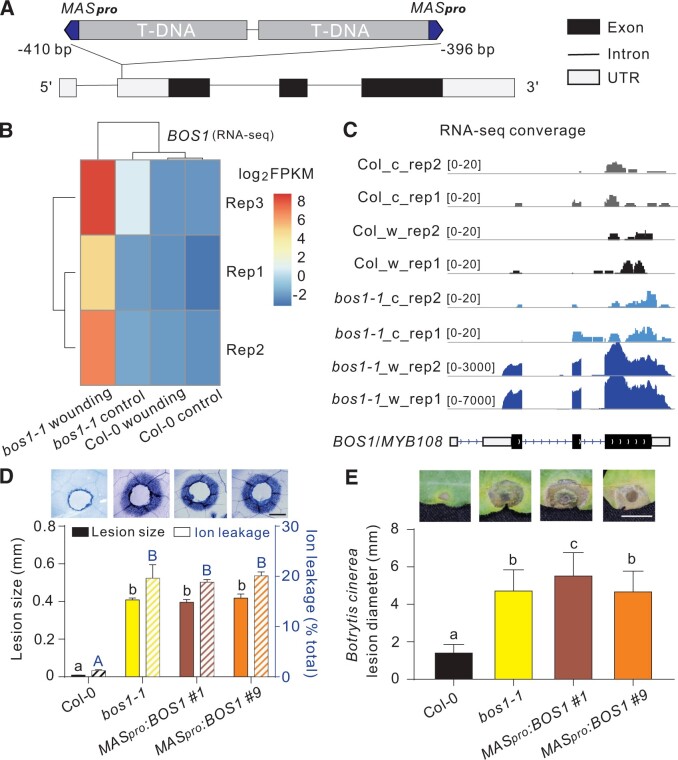
Figure 5.
Phenotypes of bos1-1 are caused by MAS promoter-driven BOS1 expression. A, Schematic illustration of bos1-1 T-DNA structure. Two adjacent T-DNAs were inserted into the 5′-UTR of BOS1 with MAS promoters indicated in blue. The insertion position of the T-DNAs in bos1-1 is relative to the BOS1 start codon. B, Expression of BOS1 3 days after wounding. Normalized transcript abundance of BOS1 was calculated from RNAseq data as fragments per kilobase pair of exon model per million fragments mapped (FPKM). The log2 FPKM values of the indicated genotypes were used to build the heat map. C, RNA-seq reads mapped to BOS1 genomic DNA. The entire coding sequence of BOS1 was expressed in bos1-1. These data are supported by Supplemental Figures S2 and S8. The c and w indicate control and wounded, respectively. D and E, MASpro:BOS1 lines phenocopied bos1-1 upon wounding (D) and Botrytis infection (E). D, Representative photos of the spread of cell death from toothpick-puncture wounds, visualized with trypan blue staining and quantified by two methods; measurement of the distance from the wound edge to the outer border of the spreading cell death (black bars; three biological repeats; n = 12 in total) and ion leakage of leaves (blue striped bars; three biological repeats; n = 12 in total). Letters above the bars indicate significance groups (P < 0.05; one-way ANOVA, Supplemental File S1), lower case letters, wound-induced lesion size; upper case letters, ion leakage. Bar = 0.5 mm. This panel is supported by Supplemental Figure S3. E, Botrytis-induced lesion size is shown both in representative photos and as quantitative data. Bars represent means ± se (three independent biological replicates; n ≥ 45 in total). Letters above the bars indicate significance groups (P < 0.05, one-way ANOVA, Supplemental File S1). Bar = 0.5 cm.

