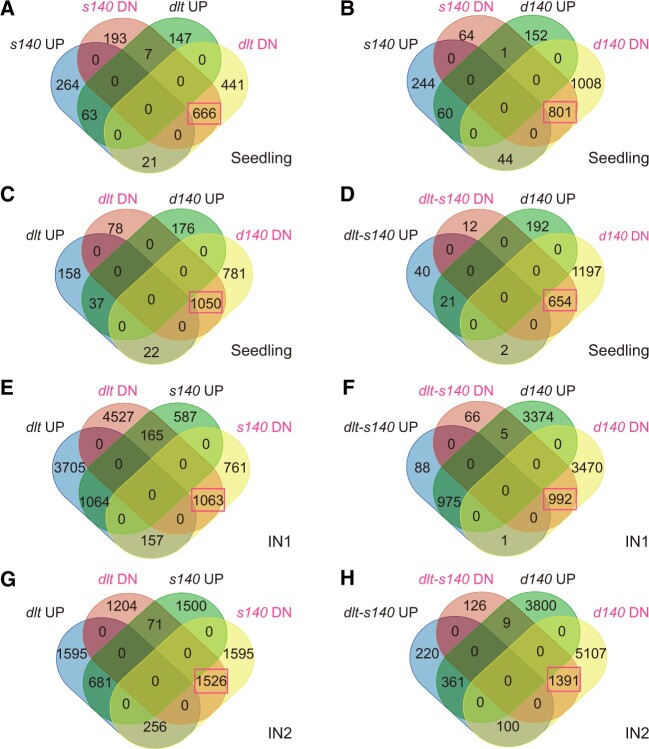
Figure 7.
DLT and OSH15 coregulate gene expression in various tissues. DEGs were identified in different tissues of the mutants via comparison with the corresponding tissues of the wild-type and subjected to overlapping analysis. Data are shown as Venn diagrams to compare the number of overlapping DEGs between sample sets, as indicated in the sectors. UP, upregulated DEGs in a mutant compared to the wild-type. DN, downregulated DEGs. The number of overlapping downregulated DEGs in different sample sets are highlighted with boxes.

