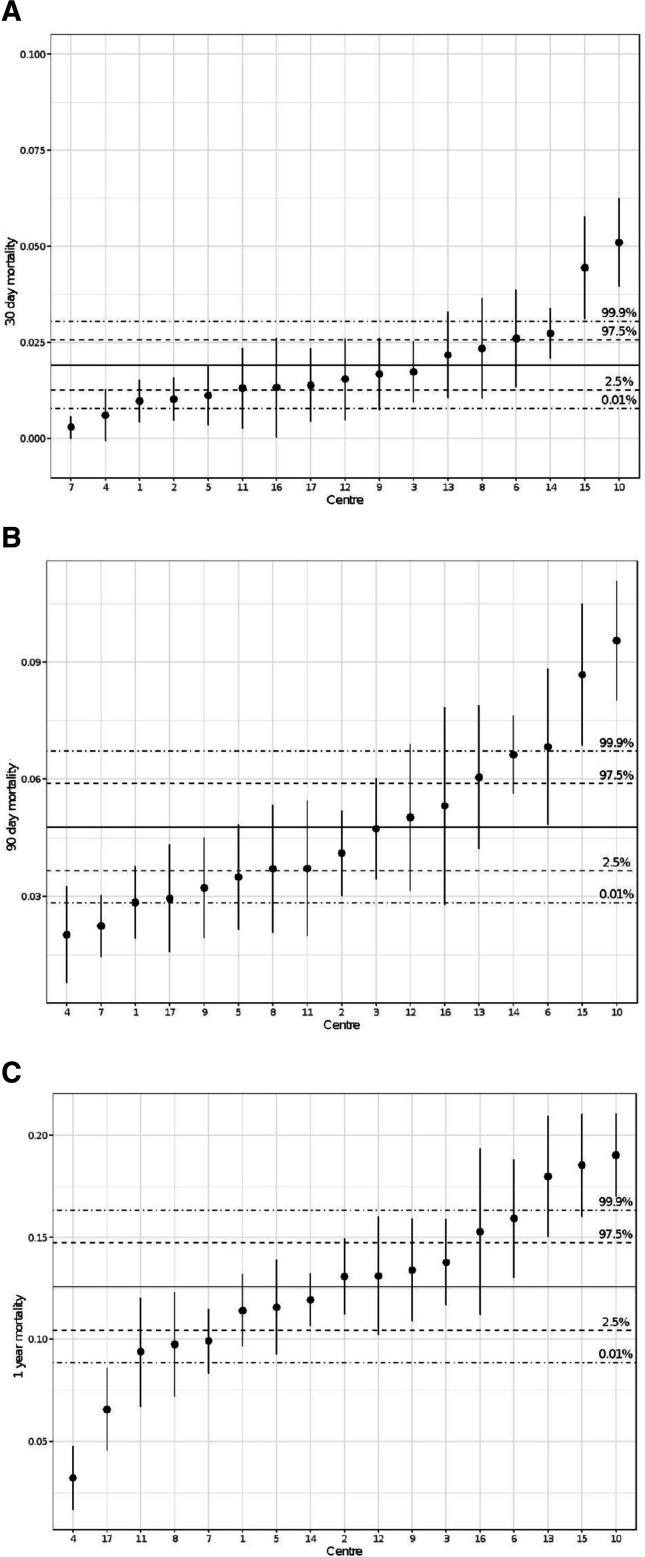
Figure 4.
Unadjusted forest plot for 30-day, 90-day and 1-year mortality among different units. Point ranges report the proportion of mortality of that centre and the associated 95% CI. The solid horizontal line is the mean mortality across all centres and the dashed lines represent the associated 95% and 99.8% confidence intervals.

