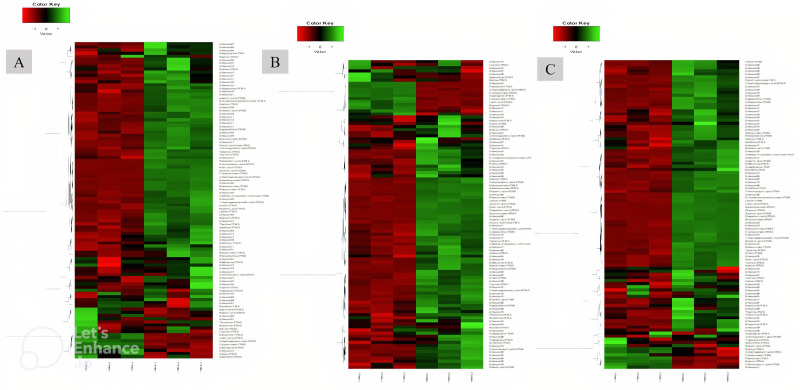
Figure 5.
Euclidean distance hierarchical clustering analysis demonstrating the different intensity levels of characteristic metabolites in the treatment groups. (A) AFO-202 group; (B) N-163 group; (C) AFO-202+N-163 (Comparison images of the telmisartan and control groups are shown in online supplemental figure 6).

