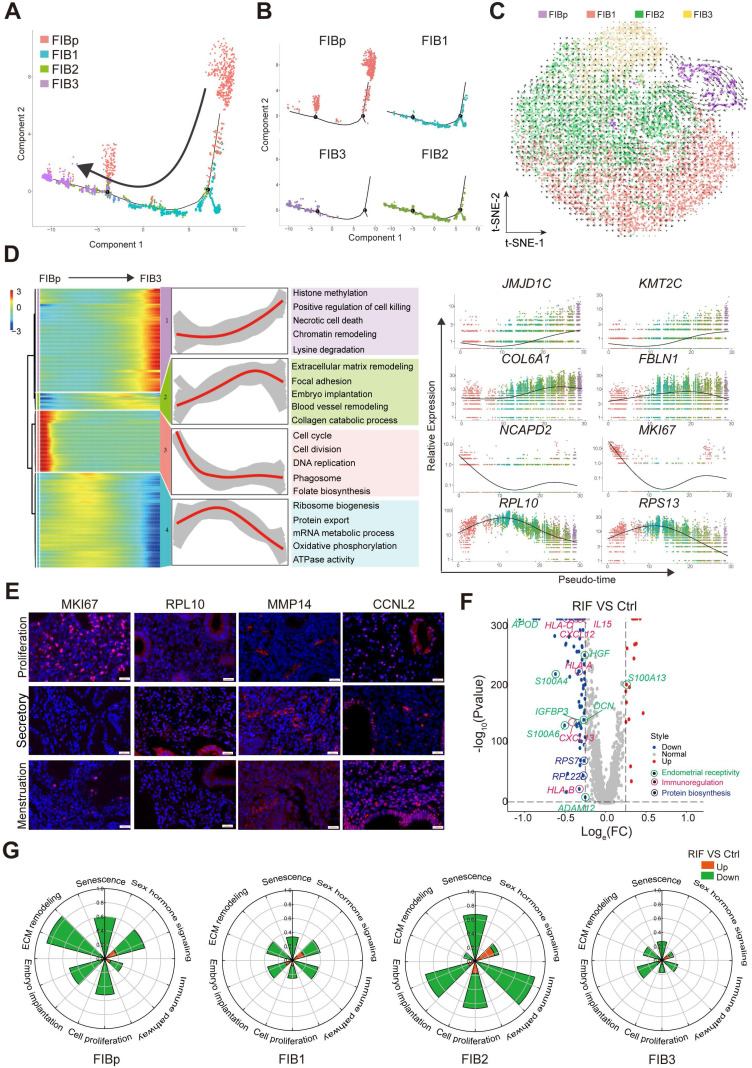
Figure 3.
Subsets of FIB with poor endometrial receptivity and immune regulation are observed in RIF patients. (A, B) Monocle pseudotime trajectory showing the progression of FIBp, FIB1, FIB2, and FIB3. (C) t-SNE with RNA velocity vectors for FIBp, FIB1, FIB2 and FIB3. (D) Expression of the genes in a branch-dependent manner. Each row indicated the standardized kinetic curves of a gene. From the left to the right of the heatmap, the kinetic curve progresses from the FIBp along the trajectory to the FIB3 (left). Based on their characteristic expression dynamics, 21480 genes were categorized into 4 clusters, and the enriched GO terms for each gene cluster were identified (middle). Expression patterns of representative genes along the reprogramming trajectory (right). (E) Immunofluorescence staining of MKi67, RPL10, MMP14, and CCNL2 in in three different menstrual cycles of endometrial stroma from controls (n = 6 for each group). Scale bar, 20 µm (times of endometrial biopsy are showed in Table S4). (F) Volcano plot showing differentially expressed genes of the four FIBs between the Ctrl and RIF groups. Red color indicates genes that are upregulated and blue color indicates downregulated genes in the RIF groups compared with the Ctrl groups. (G) Rose diagrams indicating the proportion of upregulated (red) and downregulated (green) genes in four FIBs from the RIF groups compared with the Ctrl groups. List of genes screened is shown in Tables S2.

