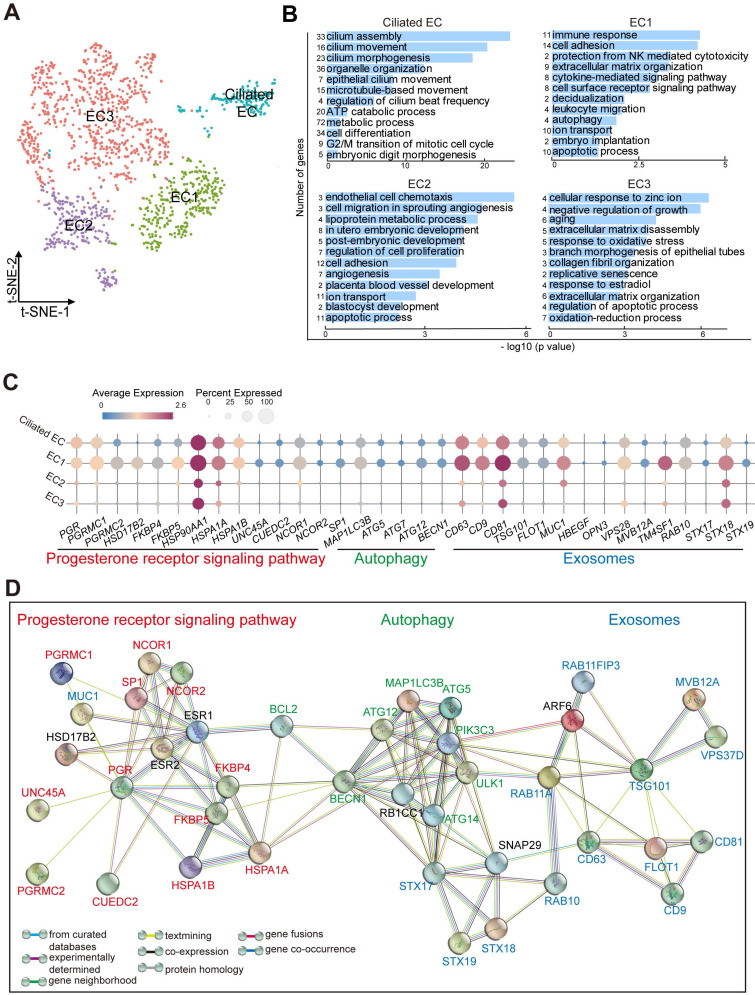
Figure 4.
Subset of endometrial epithelial cell, EC1, is diminished in the endometrium of RIF patients. (A) t-SNE map of four sub-clusters (Ciliated-EC, EC1, EC2, and EC3) of EC. (B) Significant gene markers (listed in the Supplemental Information) for each cluster in the EC were selected to perform GO analysis. The GO terms with P < 0.05 are shown. Gene number of each GO term is listed on the left. P value is shown as -log 10 (P value). (C) Bubble diagram showing average expression of selected genes (progesterone receptor signaling pathway, autophagy and exosomes-related genes) for the four sub-clusters of EC. (D) The PPI network of selected genes in (C). Different edges color presented different interactions.

