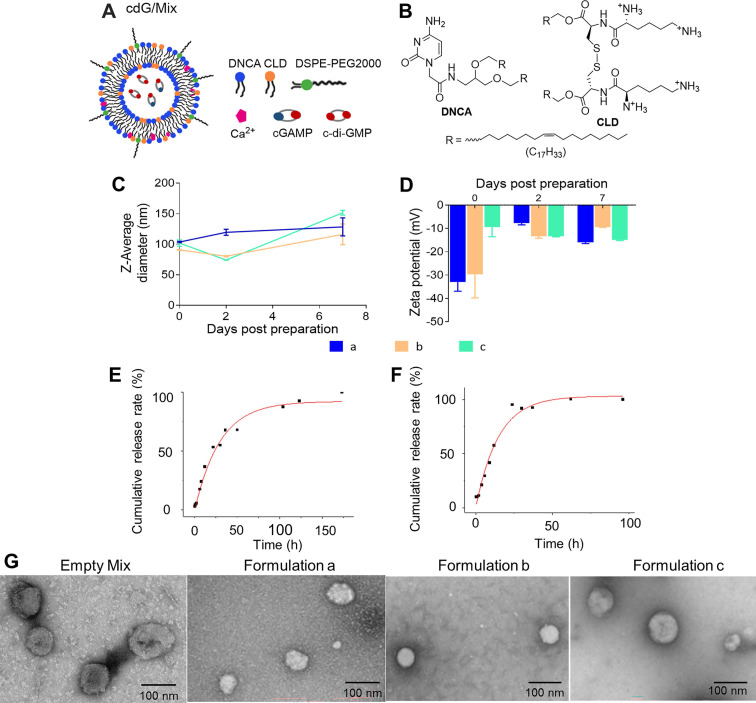
Figure 2.
The schematic diagram and characterization of nanoparticles. (A) The schematic diagram of cdG/Mix (formulation c). (B) The chemical structures of the DNCA and CLD. The size (C) and Zeta potentials (D) of various nanoparticles measured by dynamic light scattering (DLS) for 7 days (n=3). Cumulative-release profile of cdG from formulation C incubated with PBS (E) and 10% FBS (F) at 37 °C (n = 3). (G) Representative transmission electron micrographs of indicated cdG-containing preparations. Formulation a: DNCA/CLD/cdG; Formulation b: DNCA/CLD/ Ca/cdG; Formulation c: DNCA/CLD/Ca/PEG/cdG.

