Figure 6.
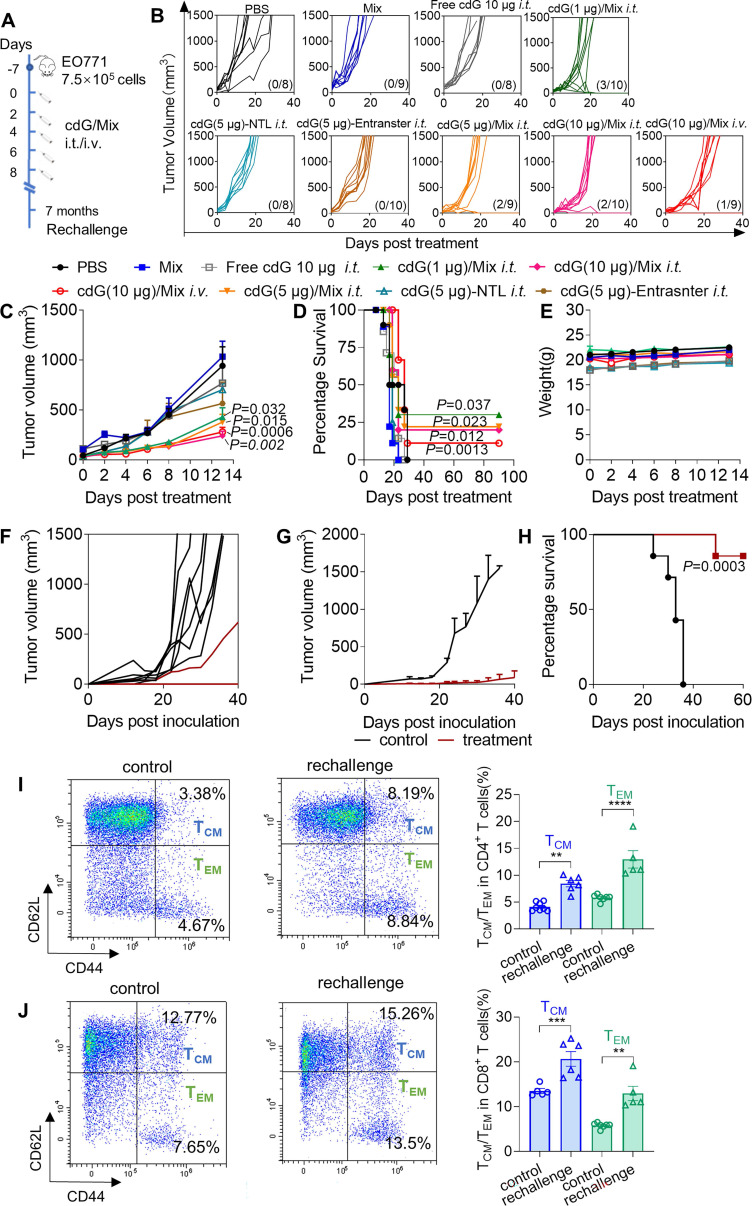
cdG/Mix enhance the immunotherapeutic efficacy at lower dosage with various administration routes. (A) cdG/Mix administration and tumor re-challenge scheme for mice with EO771 tumor. Mice with 100 mm3 subcutaneous tumors were administered PBS, empty Mix, cdG (1, 5 and 10 µg)/Mix (i.t.) and cdG (10 µg)/Mix (i.v.) five times, 2 days apart. cdG (5 µg)-NTL and cdG (5 µg)-Entranster are control preparations. Mice that cleared their tumors by treatment were injected subcutaneously in the flank 7 months later and monitored for survival. (B) Spider plots of individual tumor growth curves, with the complete response proportion denoted. (C) Mean tumor volume of mice treated with various formulations (n=8-10 mice/group; the significance of cdG (1, 5 and 10 µg)/Mix intratumorally and cdG (10 µg)/Mix intravenously versus PBS is P=0.032, P=0.015, P=0.002 and P=0.0006; two-way ANOVA). (D) Kaplan-Meier survival curves of mice treated with the indicated formulation using a 1500 mm3 tumor volume as the endpoint criteria (P = 0.037, P = 0.023, P = 0.012 and P = 0.0013 denote the significance levels of cdG (1, 5 and 10 µg)/Mix (i.t.) and cdG (10 µg)/Mix (i.v.), respectively, versus PBS group; Mantel-Cox test). (E) Mean body weight of mice following treatment with various dosage of cdG/Mix. Mean (F) and individual (G) tumor volume of treatment naïve mice and mice showing complete responses to cdG/Mix in rechallenge experiment (n = 7 or 8). (H) Kaplan-Meier survival curves of mice rechallenged with EO771 cells (n=7 or 8; Mantel-Cox test). Representative scatter plots and quantification of the percentage of CD4+ (I) and CD8+ (J) Tcm and Tem cells in blood of the rechallenged mice. All data shown are mean ± SEM.

