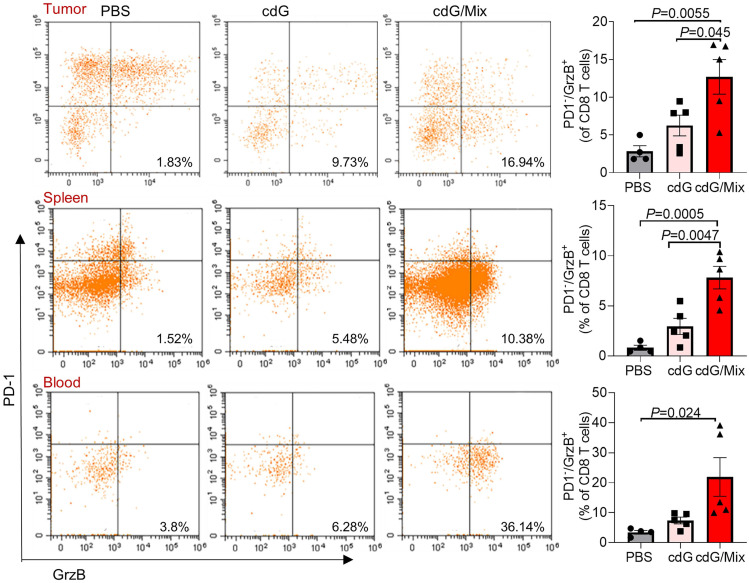
Figure 8.
Representative scatter plots and quantification of the proportion of Granzyme B+ PD-1- CD8+ T cells in the TME, spleen and blood of EO771-tumor-bearing mice 48 h after single dose of indicated formulation by intratumoral administration. All panels are from one experiment (n = 4-5; one-way ANOVA). cdG (5 µg) and cdG (5 µg)/Mix. All data shown are mean ± SEM.

