Figure 5.
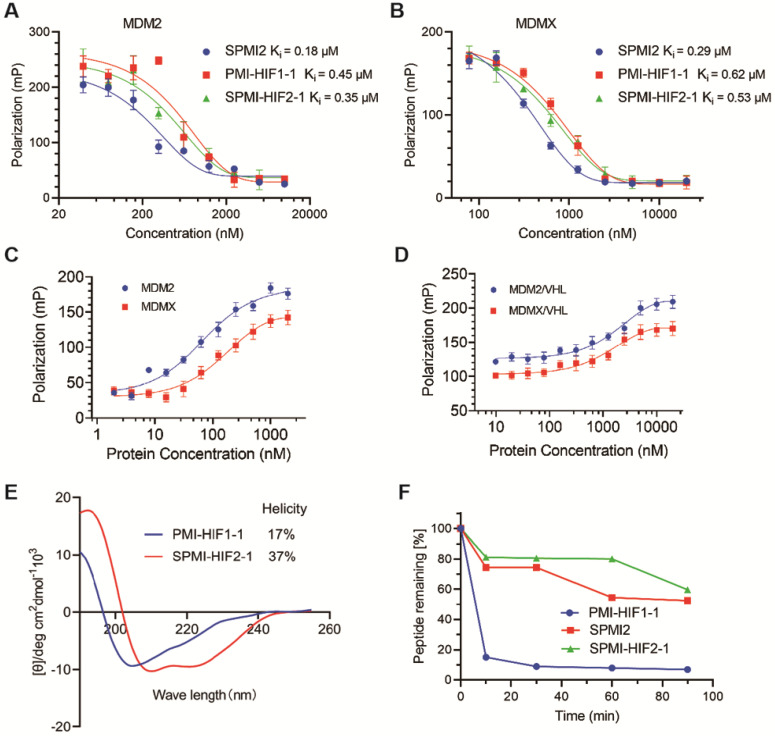
Binding, helicity, and proteolytic stability of the optimized SP-PROTAC. (A and B) Quantification assays of the interactions of MDM2 and MDMX with PMI-HIF1-1, SPMI2, and SPMI-HIF2-1 by FP-based competitive binding assays. MDM2 or MDMX protein (40 nM) was first incubated with FITC-labeled p53 peptide (20 nM) in PBS (pH 7.4), to which a serially diluted solution of test peptide was added to a final volume of 125 µL. (C) The interactions of MDM2 and MDMX with SPMI-HIF2-1 as determined by FP-based binding assays. Different concentrations of MDM2 or MDMX protein were incubated with FITC-labeled SPMI-HIF2-1 (20 nM) in PBS (pH 7.4). (D) MDM2 or MDMX protein (200 nM) was first incubated with FITC-labeled SPMI-HIF2-1 (20 nM), to which a serially diluted solution of VHL protein was added to a final volume of 125 µl. Three replicates and three independent experiments were performed; each curve is the mean of three independent measurements. FP values were measured at λex = 530 nm and λem = 580 nm on a Tecan Infinite M1000 plate reader. Curves were fitted and Ki values were calculated using GraphPad Prism software. (E) Representative CD spectra of PMI-HIF1-1 and SPMI-HIF2-1. The circular dichroism (CD) spectra were obtained on a Jasco J-715 spectropolarimeter at 20°C. The helicities of these peptides were calculated based on the values of [θ]222. (F) Proteolytic stability of PMI-HIF1-1, SPMI2, and SPMI-HIF2-1 against chymotrypsin. The percentages of the remaining intact peptides were detected by HPLC at 0, 5, 30, 60, 90, and 120 min.

