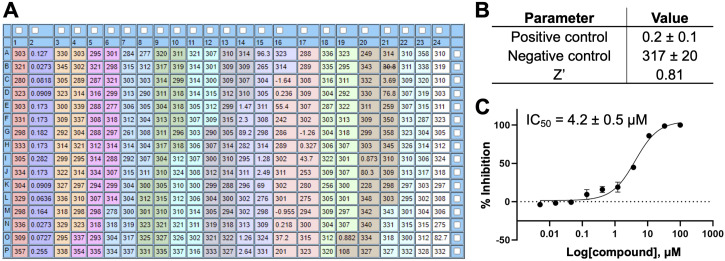
Figure 7. Representative data from a 10-point dose-response VHR inhibition assay.
(A) Plate setup and initial velocity rates. Column 1 serves as the negative control (vehicle control). Column 2 serves as the positive control (contains no enzyme). Eleven candidate compounds (marked with different colors) were tested in a 10-point dose-response format in triplicate (100, 33, 11, 3.7, 1.2, 0.41, 0.14, 0.045, 0.015, and 0.005 μM final compound concentration). Wells K23 through P24 (white) do not contain DMSO or compound and are excluded from the analysis. (B) Assay plate statistical data. Initial rates for positive and negative controls are represented as mean ± SD. For Z’-factor definition and calculation see Data analysis section. (C) Example of normalized inhibition data and fitted IC 50 curve (IC 50 ± SE; analyzed in GraphPad Prism).

