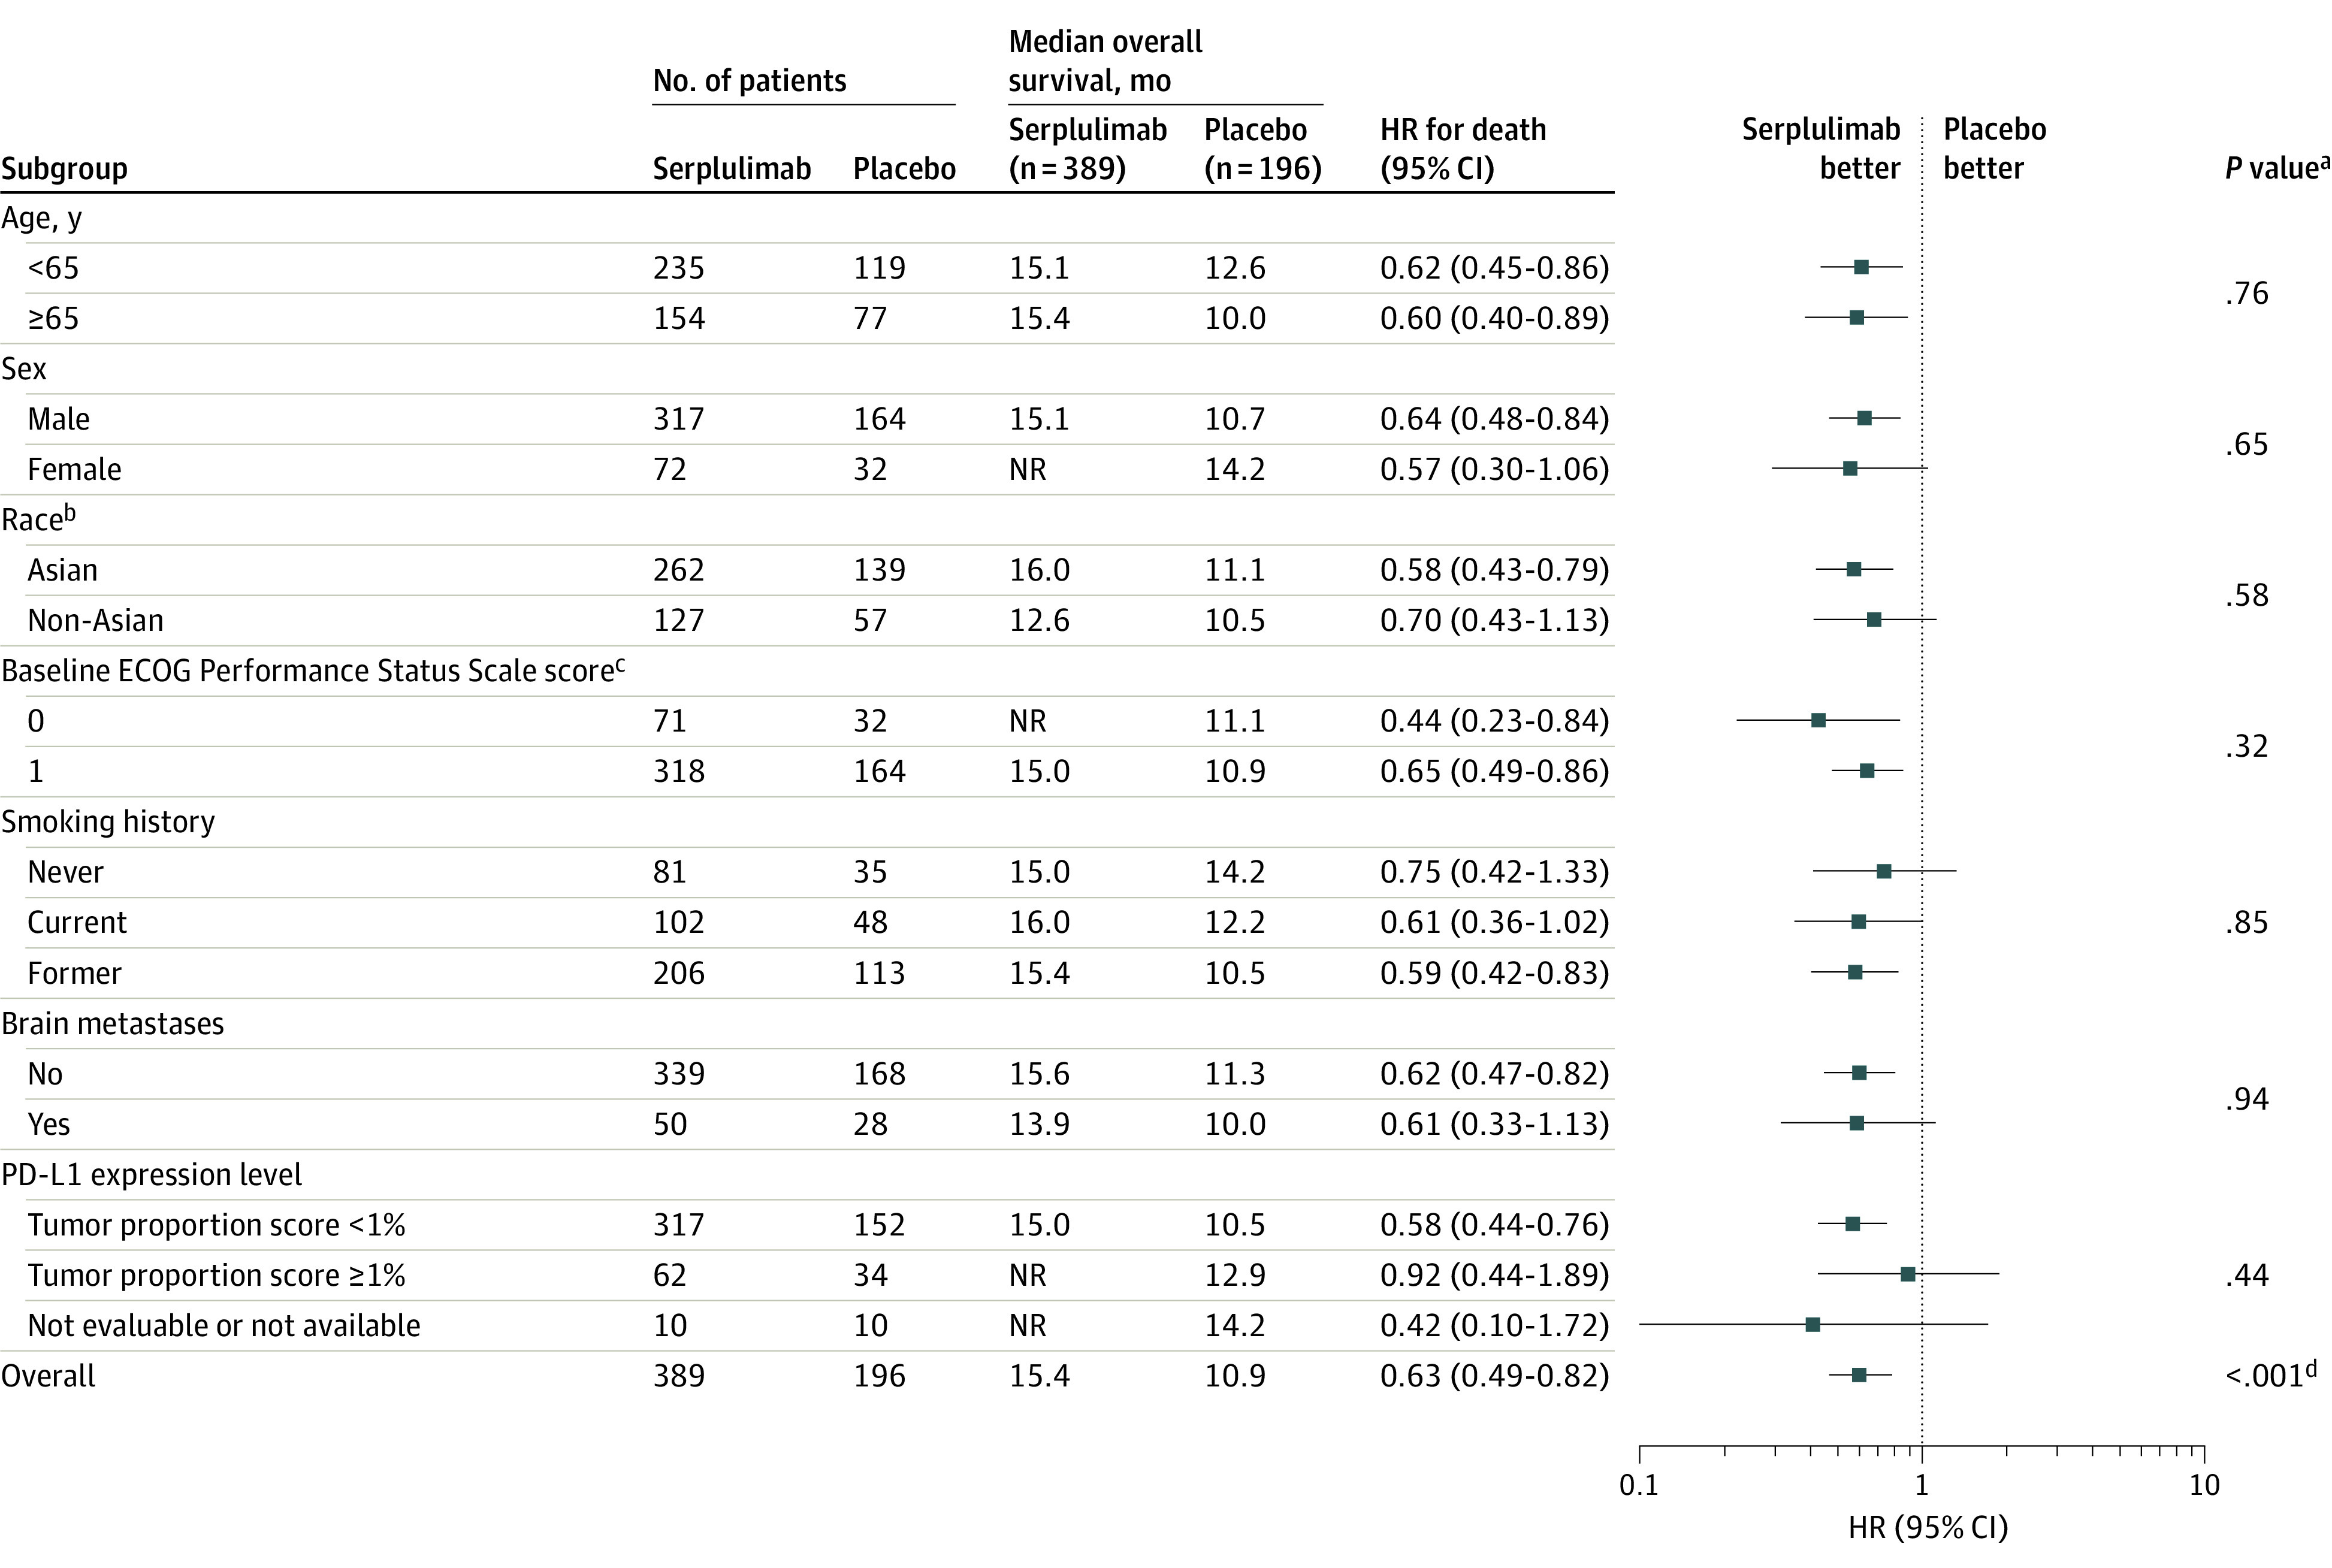
Figure 3. Subgroup Analysis for the Primary Outcome of Overall Survival.

The date of data cutoff was October 22, 2021. The hazard ratios (HRs) and P values were not stratified for the patient subgroups and were stratified for the overall population. The median duration of follow-up for overall survival at the interim analysis was 12.5 months (IQR, 8.9-15.5 months) for the serplulimab group and 12.3 months (IQR, 8.6-14.9 months) for the placebo group in the overall population. NR indicates not reached; PD-L1, programmed cell death ligand 1.
aFor the patient subgroups, the P values for interaction were calculated by adding treatment, subgroup factor, and a subgroup factor × treatment interaction term into a Cox proportional hazards model.
bSelf-reported by the patients by selecting 1 or more racial designations (American Indian or Alaska Native, Asian, Black or African American, Native Hawaiian or Pacific Islander, White, or Other) or based on identity information provided by the patients. All non-Asian patients were White.
cEastern Cooperative Oncology Group (ECOG) Performance Status Scale scores range from 0 to 5 (higher scores reflect greater disability). A score of 0 indicates fully active; 1, restricted in physically strenuous activity but ambulatory.
dCalculated using a 2-sided stratified log-rank test.
