Figure 4.
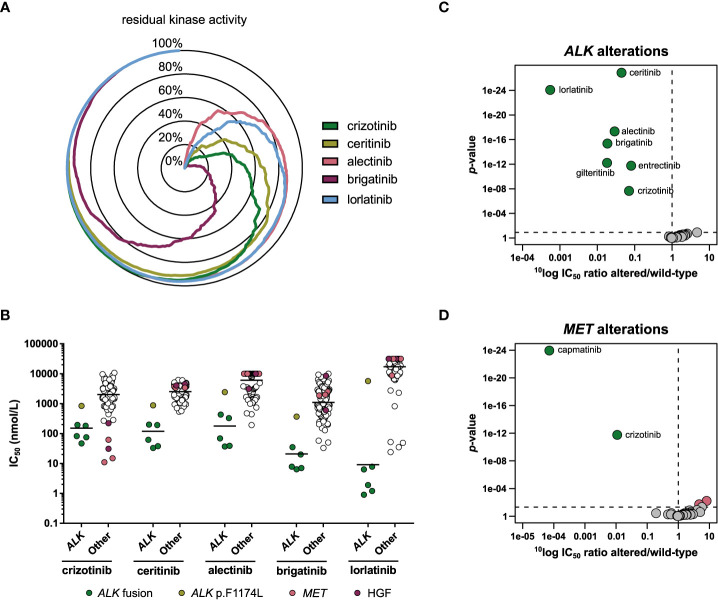
Comparison of approved ALK inhibitors. (A) Radar chart of the percentage residual activity of 255 wild-type kinases in the presence of 1 µmol/L inhibitor. (B) Scatterplots of the IC50 distribution of the three inhibitors across ALK-altered (ALK fusion or mutation) and ALK wild-type cell lines. The horizontal lines indicate the geometric means. Cell lines harboring ALK fusions, an ALK gene mutation, a MET gene alteration, or autocrine expression of HGF are indicated in different colors. (C) Volcano plot comparing the IC50 difference between ALK-altered and wild-type cell lines for 34 inhibitors. Green nodes indicate inhibitors which are significantly more potent in ALK-altered cell lines compared to ALK wild-type cell lines, as determined by MANOVA. (D) As panel C, but for MET-altered cell lines. Red nodes indicate inhibitors which are significantly less potent in MET-altered cell lines.

