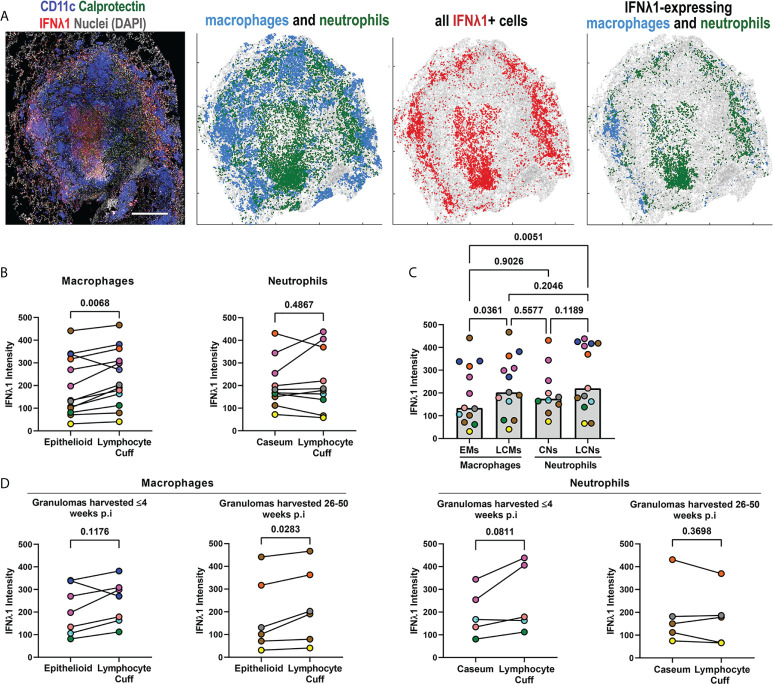
Figure 3.
IFNλ1 expression varies by granuloma microenvironment. (A) A representative granuloma stained to identify IFNλ1 (red) expressed by CD11c+ macrophages (blue) and calprotectin+ neutrophils (green). Scale bar represents 500 μm. Spatial distribution of macrophages (blue) and neutrophils (green) in the granuloma, distribution of IFNλ1 (red), and distribution of IFNλ1+ macrophages (blue) and neutrophils (green). (B) Comparison of IFNλ1 expression, as measured by median fluorescence intensity for each cell subset per granuloma, for epithelioid and lymphocyte cuff macrophages (n=13) (left), and caseum and lymphocyte cuff neutrophils (n=10) (right). Statistical comparisons by paired t test. (C) Comparison of median IFNλ1 intensity in epithelioid macrophages, lymphocyte cuff macrophages, caseum neutrophils, and lymphocyte cuff neutrophils (n=13 granulomas). A mixed effect test used to account for repeated measures and pairwise groups compared using Tukey’s multiple comparisons test (Tukey adjusted p-values reported). (D) Comparison of IFNλ1 expression, as measured by median fluorescence intensity, between epithelioid and lymphocyte cuff macrophages (left) in granulomas harvested within 4 weeks post-infection (n=7) or 26-50 weeks post-infection (n=6). A similar comparison of IFNλ1 expression by caseum and lymphocyte cuff neutrophils (right) from granulomas harvested by 4 weeks post-infection (n=5) or between 26-50 weeks post-infection (n=5). Statistical comparisons by paired t test.

