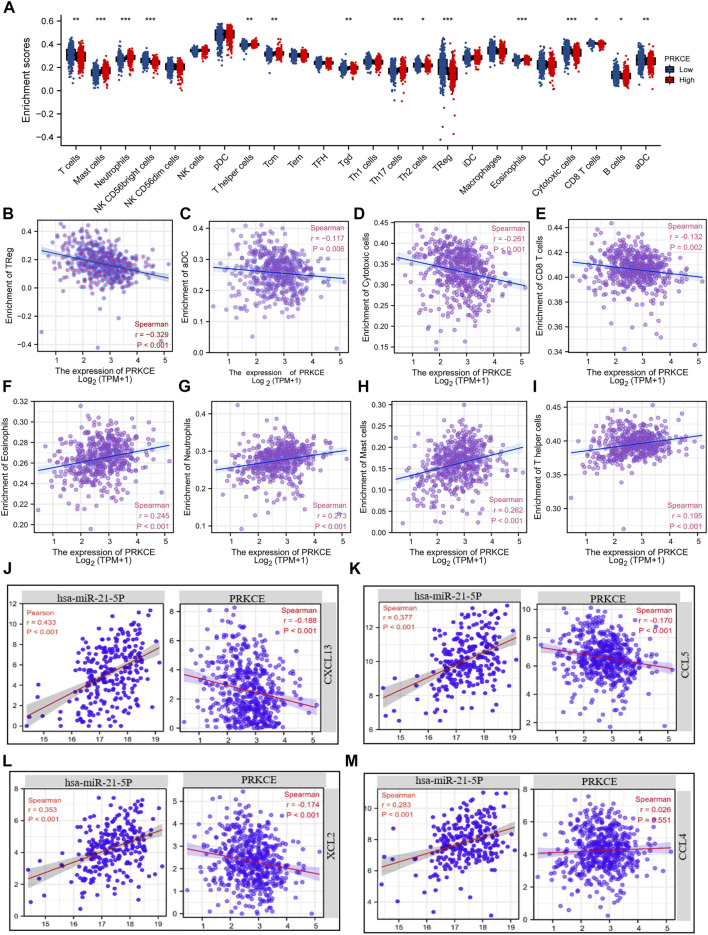
FIGURE 6.
Chemokines mediated the regulatory effects of PRKCE on immune cell infiltration. (A) Proportions of the 24 tumor-infiltrating immune cell types in low and high expression groups of PRKCE. (B–E) PRKCE expression significantly negatively correlates with infiltrating levels of (B) Treg, (C) aDC, (D) Cytotoxic, and (E) CD8 T cells. (F–I) PRKCE expression significantly positively correlates with infiltrating levels of (F) Eosinophils, (G) Neutrophils, (H) Mast cells, and (I) T helper cells. (J–M) Pearson’s correlation analysis was applied to explore the relationships between the hsa-miRNA-21-5p/PRKCE axis and 4 Chemokines (CXCL13, CCL5, XCL2, and CCL4).

