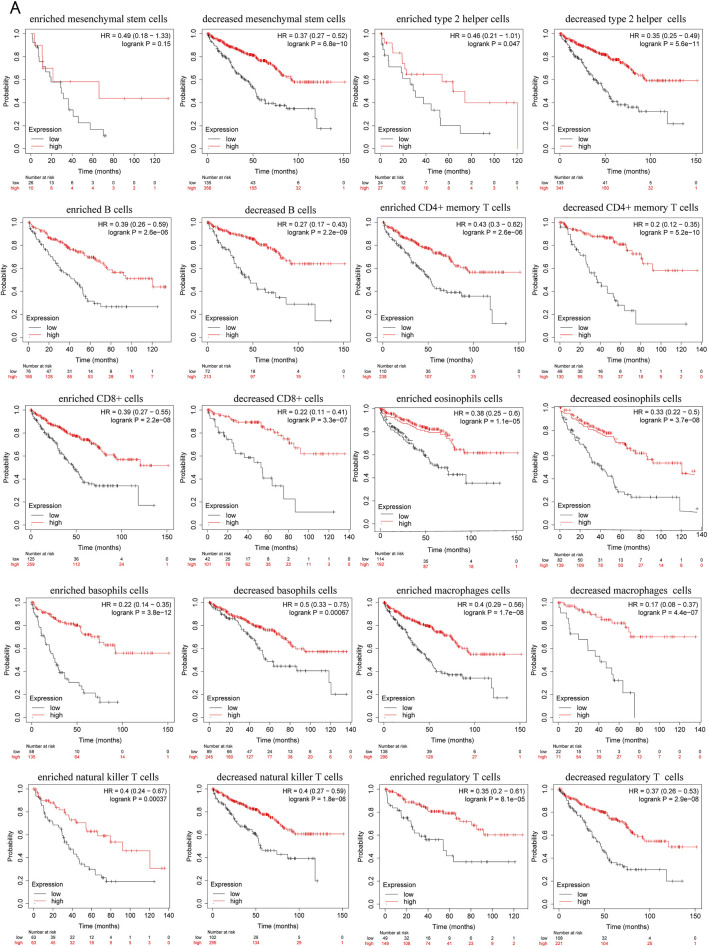
FIGURE 8.
Kaplan–Meier survival plots comparing the low and high expression of PRKCE in different types of immune cell subgroups in the Kaplan–Meier plotter. (A) overall survival curves display the prognostic value of PRKCE expression based on different immune cell subgroups in Kaplan-Meier Plotter.

