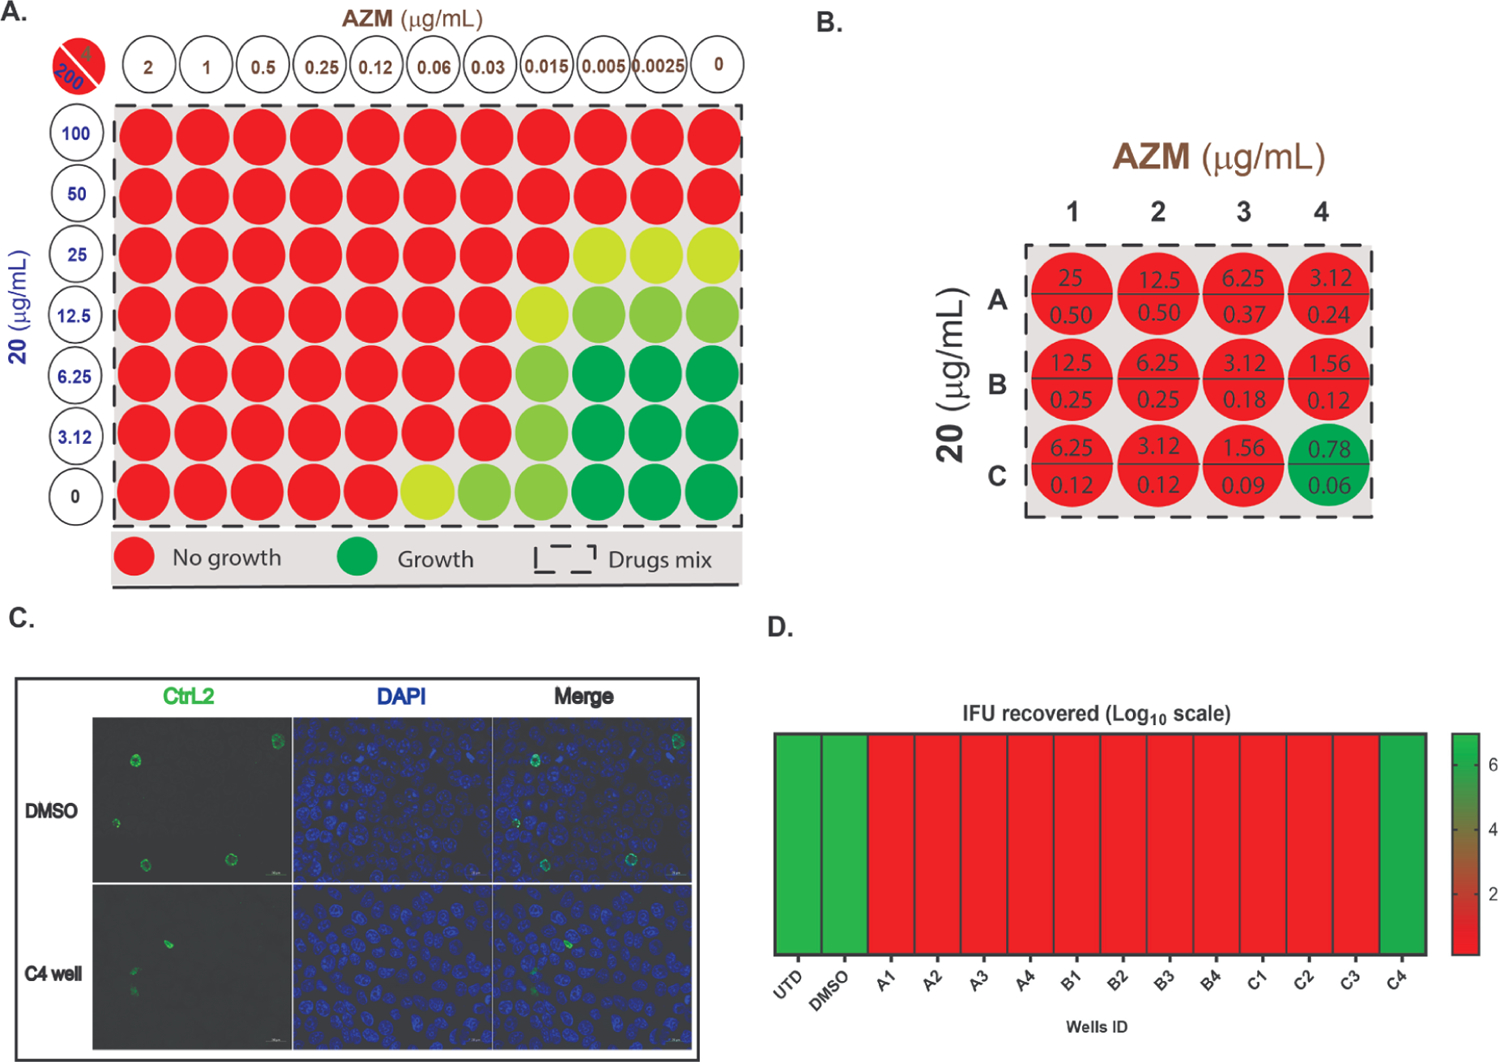
Figure 6.

Effect of AZM and 20 combinations on Chlamydia growth showing the degree of growth in color codes; red (no growth); very faint green (<50% growth); light green (50% growth); and dark green (>50% growth) in comparison with an untreated sample; (A) representation of checkerboard assay; columns indicate 20 at different concentrations, rows show AZM at several dilutions, and the box indicates the combinations. For example, the upper left most well has a concentration of 20 at 200 μg/mL and AZM at 4 μg/mL. Data represent three biological replicates. (B) Titration assay diagram of AZM and 20 combinations. Stock solutions of AZM and 20 were mixed, in two directions. Then, 1 μL of each well was transferred into Chlamydia-infected HEp-2 cells (in triplicate) 6 h after infection to obtain the concentrations, as shown in the diagram (μg/mL). For example, well A1 has a concentration of 20 at 25 μg/mL and AZM at 0.5 μg/mL, whereas well B2 has a concentration of 20 at 6.25 μg/mL and AZM at 0.25 μg/mL. (C) Infection output in the case of untreated sample and well C4; samples were stained for MOMP (Ctr L2; green) and DNA (DAPI; blue). (D) Representation of quantified Ctr growth by IFU assay after second round of infection compared to untreated (UTD) and DMSO treatment as controls. Data represent three biological replicates.
